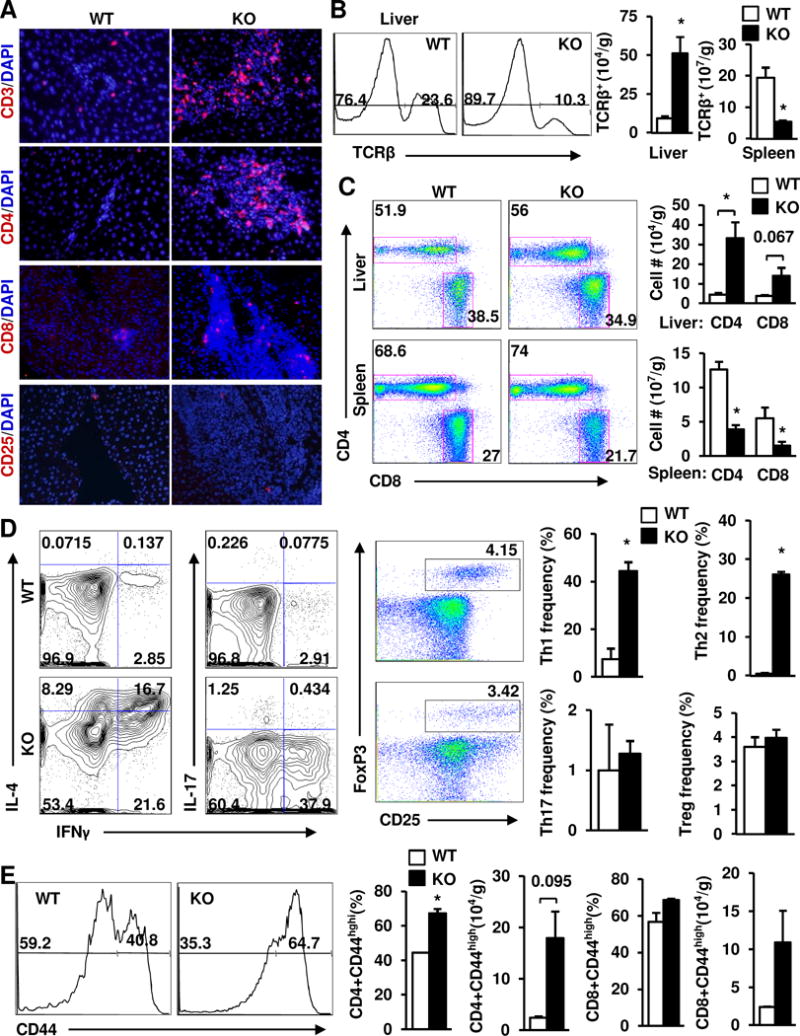
Fig. 4. Heavy hepatic infiltration of Th1 and Th2 T cells in NIK KO mice.

(A) Liver sections were prepared from males (7 weeks) and immunostained with the indicated antibodies (representatives of 4 pairs). (B-E) Livers and spleens were harvested from female mice at 6 weeks of age (n=3) and used to analyze T cell subpopulations by flow cytometry. (B) Total TCRβ+ T cells (normalized to tissue weight). (C) The CD4+ and CD8+ T cell subpopulations (normalized to tissue weight). (D) The Th1, Th2, Th17, and Treg subpopulations. (E) The effector/memory T cell subpopulations (CD44high). Data were statistically analyzed with two-tailed Student’s t test, and presented as mean ± SEM. *p<0.05.
