
Figure 4.
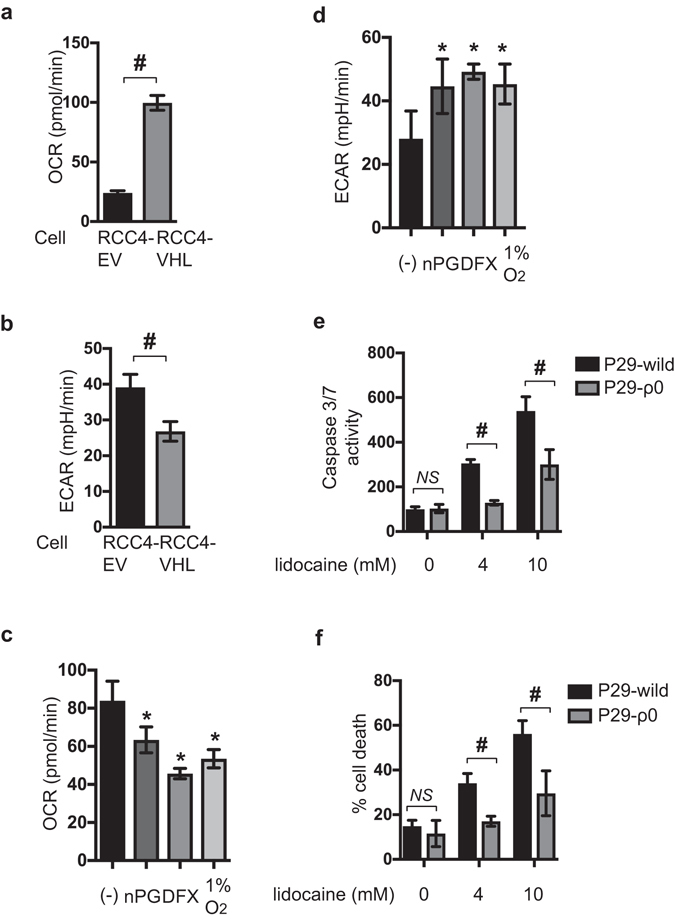
Reprogrammed oxygen metabolism is established in RCC4-EV cells. Oxygen consumption rate (OCR) (a and c) and extracellular acidification rate (ECAR) (b and d) in RCC4-EV cells and RCC4-VHL cells (a and b) in normoxic (20% O2) conditions and RCC4-VHL cells exposed to nPG, DFX, or hypoxic (1% O2) conditions (c and d). P29 cells and P29 ρ0 cells were exposed to the indicated lidocaine dose for 24 h (e and f). Graphic depiction of caspase-3/7 activity (n = 5) (e). Cells were harvested, and the levels of cell death percentages were analyzed by flow cytometry. The ratio of propidium iodide (PI)-positive and/or annexin V-positive cells [(Q1 + Q2 + Q4)/(Q1 + Q2 + Q3 + Q4)] was used to calculate the percentage of dead cells (Supplemental Fig. S1) (n = 3) (f). Cells were harvested, and the levels of cell death were analyzed by flow cytometry (f). The ratio of propidium iodide (PI)-positive and/or annexin V-positive cells [(Q1 + Q2 + Q4)/(Q1 + Q2 + Q3 + Q4)] was used to calculate the percentage of dead cells (n = 3). Data presented in (a–f) are expressed as means ± standard deviations (SD). Differences between results were evaluated by the t-test (a and b), one-way ANOVA (c and d) followed by Dunnett’s test for multiple comparisons (c and d), and two-way ANOVA (e and f) followed by Dunnett’s test for multiple comparisons (e and f). *p < 0.05 compared to the control cell population. # p < 0.05 compared to the indicated experimental groups.