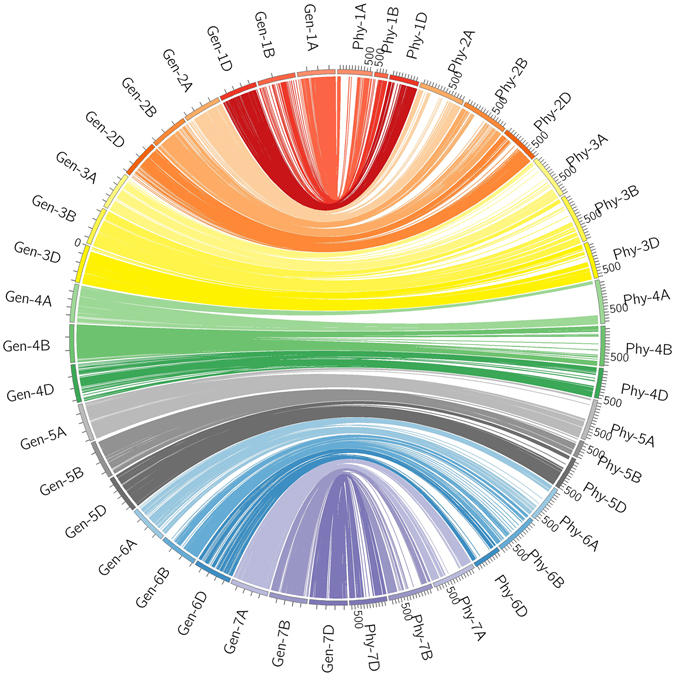
Figure 3.

Schematic representation of the syntenic relationships between any one marker in wheat genetic and physical maps. Gen-1A to Gen-7D represent the 21 wheat chromosomal genetic maps released in this paper; Phy-1A to Phy-7D represent the 21 wheat chromosomal physical maps, which were constructed by assigning 116 261 SNPs to the wheat genome assembly using SNP flanking sequences as the query. For the redundant loci that showed co-segregation in the 188 KJ-RILs, only one unique informative marker is shown in this figure.
