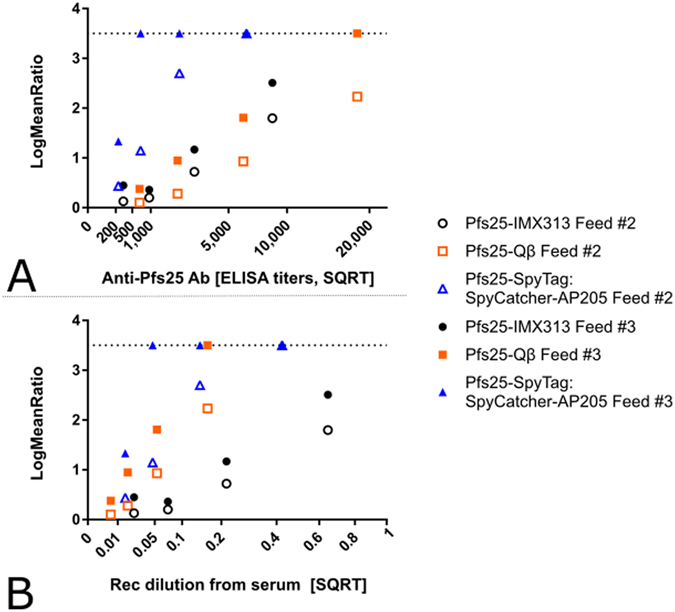
Figure 5.

Comparison of the quality of the anti-Pfs25 IgG induced by nanoparticle vaccines. (A) The square root of anti-Pfs25 specific IgG level in the feeder is shown on the x-axis. The ratio of mean oocyst counts in control and test samples are plotted on a log scale along (log-mean ratio, LMR) the y-axis. (B) The reciprocal of the dilution factor from the original serum pool is plotted on the x-axis. LMR is plotted on the y-axis. When a test sample showed 100% inhibition in the SMFA, the LMR was assigned as 3.5 (dotted line) in the figures.
