
Figure 2.
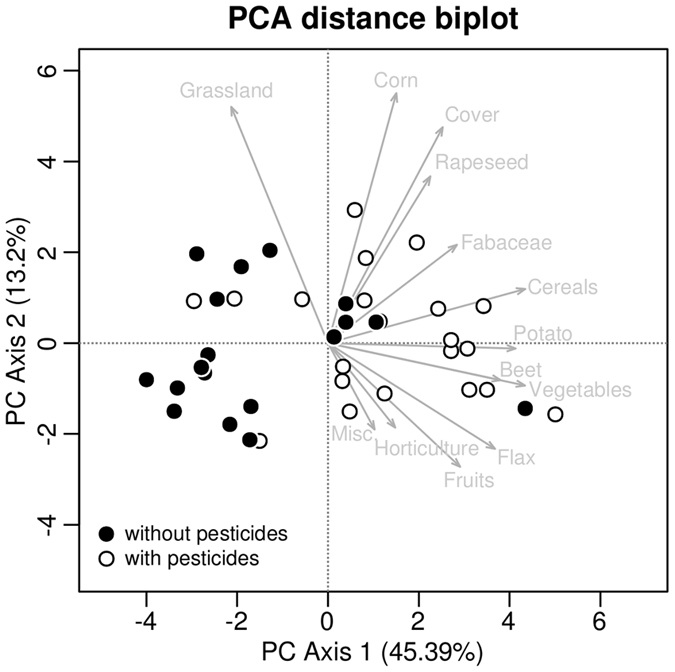
Principal Component Analysis distance biplot of the areas of crops and grasslands 3000 m around the apiaries. The areas were square root transformed and standardized before the analysis.
Official websites use .gov
A
.gov website belongs to an official
government organization in the United States.
Secure .gov websites use HTTPS
A lock (
) or https:// means you've safely
connected to the .gov website. Share sensitive
information only on official, secure websites.
Principal Component Analysis distance biplot of the areas of crops and grasslands 3000 m around the apiaries. The areas were square root transformed and standardized before the analysis.