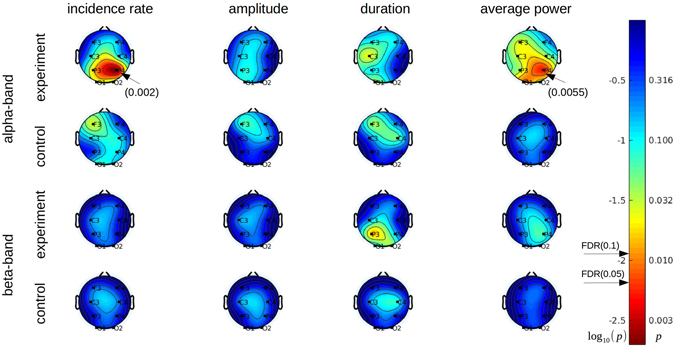
Figure 4.

Statistical analysis of Q α(t) waveform morphology in terms of the incidence rate of alpha spindles (first column), their duration (second column), amplitude (third column) and average power (fourth column). The electrodes exhibiting significant changes are pointed by the arrows with the corresponding p–values specified in brackets. A linear colormap encodes the log10 p-values obtained from the permutation test of no difference between days 1 and 2. Non-logarithmic p-values are also shown on the outer side of the colorbar. Beta band changes are included in the analysis as a control for frequency band specificity. Significant differences that pass the FDR (0.1) correction for multiple comparisons are observed only for the spindles incidence rate parameter at P4 (p = 0.002) and for the average power at the same electrode (p = 0.0055). These differences correspond to a greater mean value observed on day 2, as compared to day 1. Note that changes in the incidence rate parameter are more spatially specific and better correspond to the goal of neurofeedback training of enhancing alpha rhythm power at P4 than the average power changes (top row, rightmost column).
