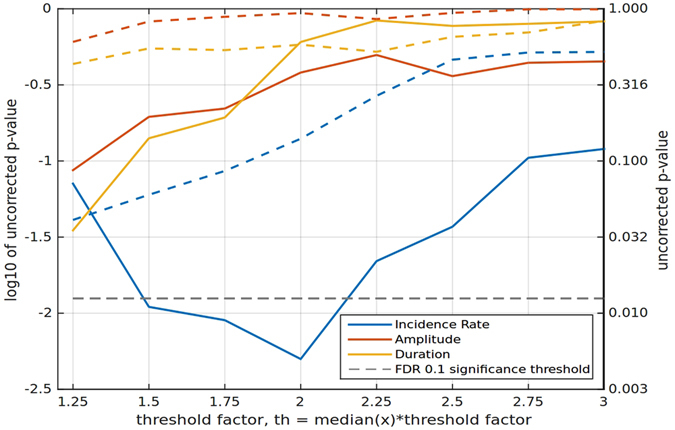
Figure 5.

The effect of varying the spindle detection threshold. The p–value for the three parameters (spindle amplitude, incidence rate and duration) calculated from P4 electrode data for different threshold values is shown. The dashed lines correspond to the sham feedback group and the solid lines to the experimental group. The observed significance of alpha spindles incidence rate increase persists for a large range of threshold values.
