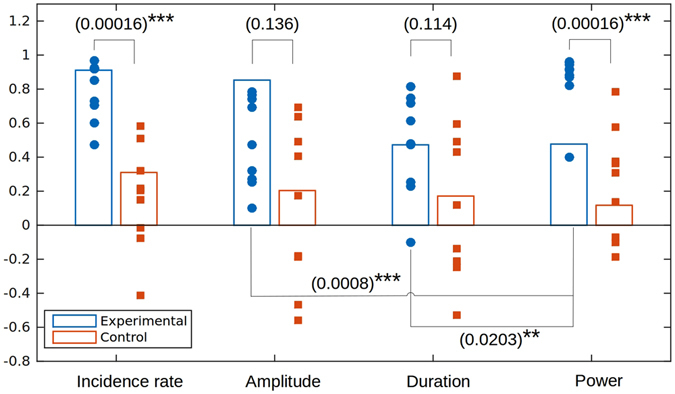
Figure 8.

Summary of the results of the correlation analysis for different alpha-activity parameters for the experimental and control groups. For each subject, we plotted the points representing daily correlation coefficient for each of the four parameters of alpha activity: average power, spindles incidence rate, spindles amplitude and duration. Additionally, the bar plots represent average correlation coefficients for each group (blue for the experimental group; orange for the control group). Between group comparison shows that the experimental group data demonstrate high average correlation coefficients (p < 0.0001) for the power and spindles incidence rate parameters. No significant correlations are observed for the control group. Only the average power and spindles incidence rate features demonstrate highly significant differences between the experimental and control groups (Wilcoxon rank-sum test, p = 0.00016). No statistically significant differences are observed between the experimental and the control groups for spindle amplitude (p = 0.136) and spindle duration (p = 0.114) features. Only within the experimental group we observe a highly significant positive difference between the studied correlation coefficients for the spindle incidence rate and spindle amplitude parameter (p = 0.0008) as well as the spindle duration parameter (p = 0.0203).
