
Figure 3.
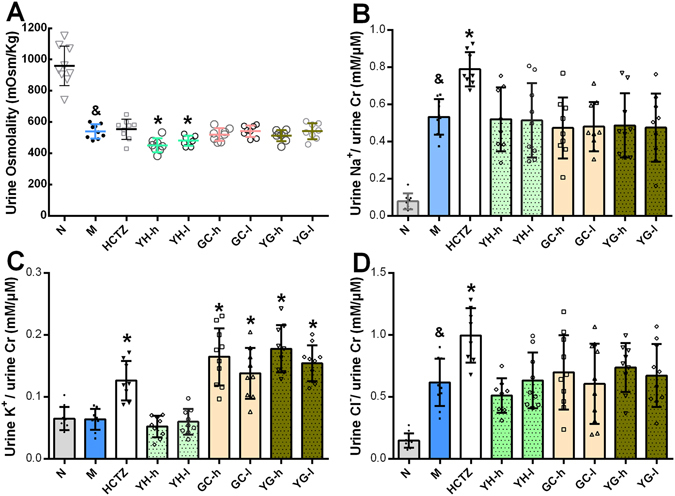
Urine output changes were related to urine concentrating ability and irrelevant to urine ion excretion. (A) Urine concentrating ability was reflected by urine osmolality (n = 7–10), higher osmolality means more concentrated primary urine. Water loading itself largely decreased urine osmolality, YH could further lower it, whereas GC and YG had no effect. HCTZ also failed to influence urine osmolality. (B to D) Total amount of Na+, K+, Cl− excretion, calculated by urine electrolytes concentration standardized by urine Cr concentration (n = 7 to 10). Water loading with NS (M group) caused large amount of NaCl excretion, but have little influence on K+. HCTZ diluted urine through accelerating Na+ and Cl− excretion, meanwhile caused K+ loss. GC also caused K+ loss while YH did not influence these ion excretions, so the UCF changes cannot be explained by ion excretion. & P < 0.05 compared to N group; *P < 0.05 compared to M group.