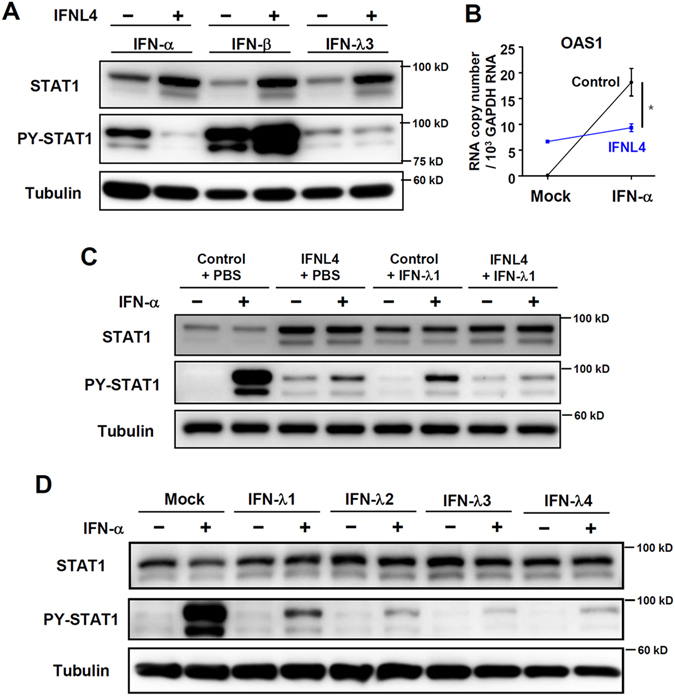
Figure 4.

Cells that overexpress IFN-λ4 or treated with IFN-λ4 show weaker responses to IFN-α treatment. (A,B) Huh-7 cells were transfected with control or IFN-λ4-expressing plasmids. After 96 hours, the cells were treated with 100 IU IFN-α, 1 ng/mL IFN-β, or 100 ng/mL IFN-λ3. The cells were harvested after 15 minutes, and protein expression was analysed by immunoblotting (A), or the cells were harvested after 6 hours, and gene expression was analysed by real-time qPCR (B). Data are presented as means ± S. E. M. *P ≤ 0.05, ***P ≤ 0.001 (Student’s t-test). (C) Huh-7 cells were transfected with control or IFN-λ4-expressing plasmids. After 24 hours, the transfected cells were treated with PBS or IFN-λ1 (10 ng/ml). After 48 hours, the cells were treated with 100 IU IFN-α for 15 minutes. The cells were harvested, and protein expression was analysed by immunoblotting. All the data are representative of two independent experiments. (D) Huh-7 cells were treated with mock or 10 ng/mL recombinant IFN-λ1, 2, 3, or 4. After 72 hours, the cells were treated with 100 IU IFN-α. The cells were harvested after 30 minutes, and protein expression was analysed by immunoblotting. All the data are representative of two independent experiments.
