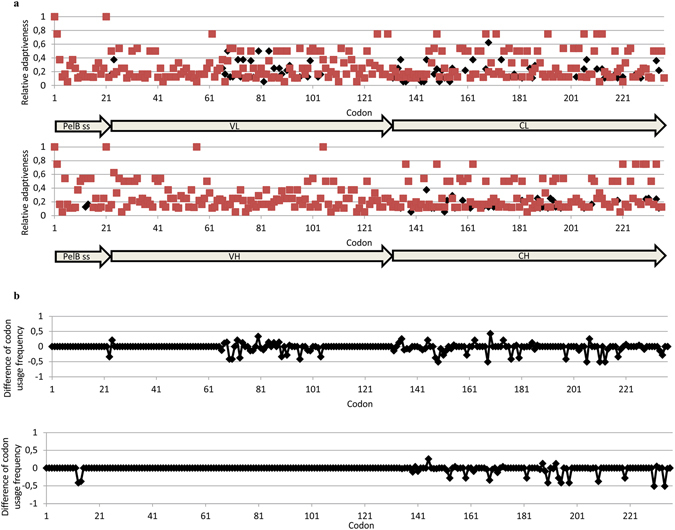
Figure 2.

Codon usage of sFab and Fab0. In both figures, the light chain is represented in the upper and the heavy chain in the lower diagram. (a) The relative adaptiveness diagrams showing the codon usage of sFab (red) and Fab0 (black). (b) Diagrams showing the difference of codon usage frequency between sFab and Fab0. Peaks above zero indicate that a codon of Fab0 has higher frequency than the corresponding sFab codon and vice versa.
