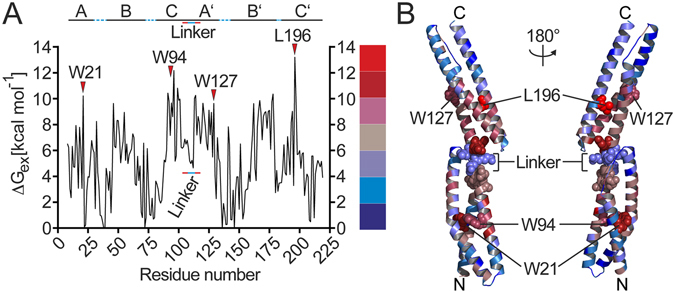
Figure 4.

Stability fingerprint of R1617 determined by HR-HDXMS. (A) Plot of the free energy value ΔGex for each amino acid residue of R1617. The linker region between repeats 16 and 17 and amino acids adjacent to the linker are indicated by solid blue and red lines, respectively. Amino acid residues exhibiting high stability are indicated. (B) The crystal structure of R1617 (PDB: 1CUN23) colored according to the ΔGex values shown in (A).
