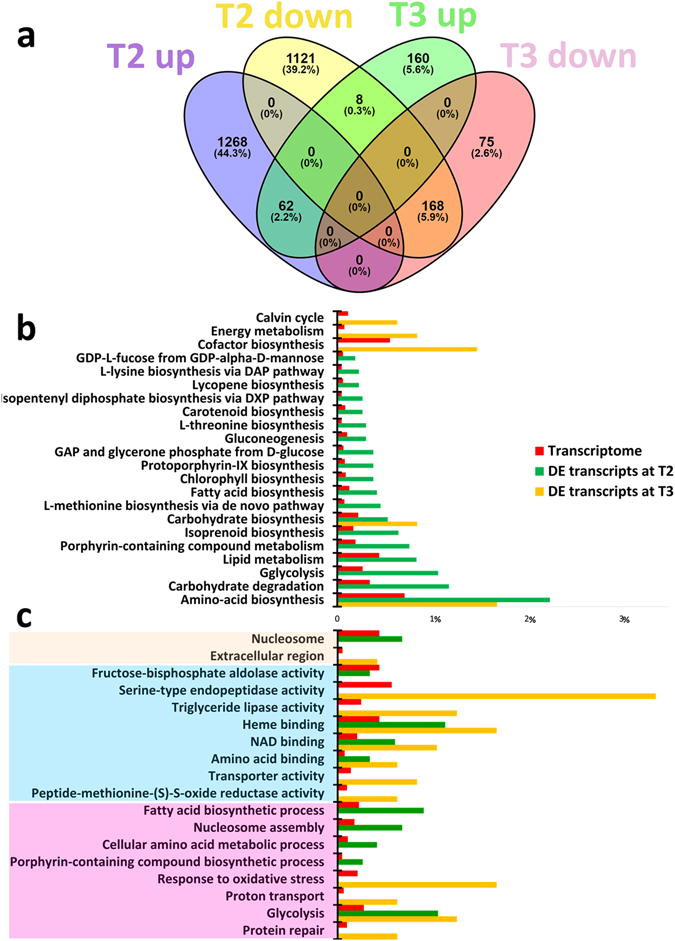
Figure 1.

Differential expression analyses in Chaetoceros decipiens. (a) Venn diagram of DE transcripts at time points T2 and T3. Number of transcripts and percentage are shown. Venn diagrams have been produced using Venny 2.0 online software71. (b,c) Representation of (b) KO pathway level 1 and (c) GO terms significantly enriched for DE transcripts. The charts show the proportion of transcripts associated to the significant classes for DE transcripts at time points T2 (green) and T3 (yellow) and their respective proportion in the assembled reference transcriptome (red). Colour shades indicate cellular components (ochre); biological processes (blue); molecular function (pink). On the x-axis, the percentage of transcripts associated to a given KO (b) or to a specific GO term (c) calculated over the total number of transcripts in the given dataset is reported.
