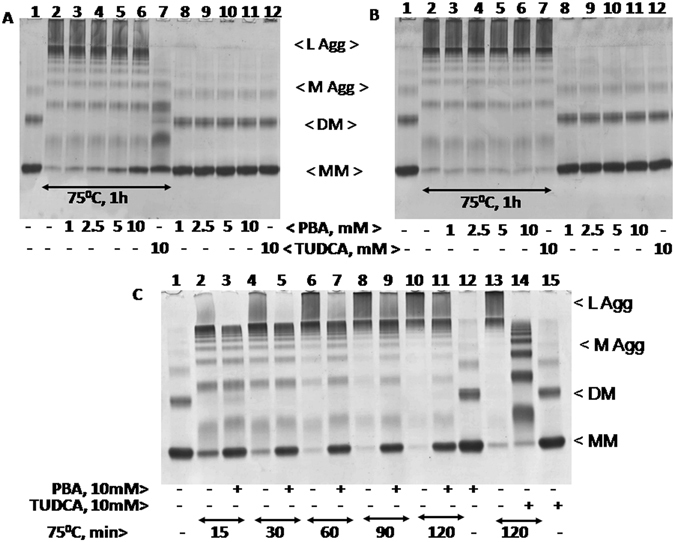
Figure 1.

Heat induced aggregation of BSA in the presence of PBA or TUDCA: BSA (2 mg/ml) was heat treated at 75° C for 1 h in the presence and absence of different concentrations of PBA (1–10 mM) or 10 mM TUDCA either during heat treatment (Panel A) or after heat treatment (Panel B). Samples were analyzed by 8% Native-PAGE. The various lanes in Panel A and B are: 1, Control BSA; 2, heat treated BSA at 75° C for 1 h; 3–6, heat treated BSA in the presence of 1, 2.5, 5, and 10 mM PBA respectively; 7, heat treated BSA in the presence of 10 mM TUDCA; 8–11, native or control BSA in the presence of 1, 2.5, 5, and 10 mM PBA; 12, native BSA with 10 mM TUDCA. Abbreviations are as follows: L Agg and M Agg refer to large and medium aggregates; DM and MM refer to dimers and monomers respectively. Panel C represents heat induced aggregation of BSA at 75° C in the presence and absence of 10 mM PBA for different time periods (15, 30, 60, 90, and 120 min) or 10 mM TUDCA for 120 min. The various lanes are: 1, native BSA; 2, 4, 6, 8, and 10, BSA samples heat treated for 15, 30, 60, 90, and 120 min respectively; 3, 5, 7, 9, and 11, BSA samples heat treated for 15, 30, 60, 90, and 120 min respectively in the presence of 5 mM PBA; 12, native BSA with 5 mM PBA; 13, BSA heat treated for 120 min; 14, BSA heat treated for 120 min in the presence of 10 mM TUDCA; 15, native BSA with 10 mM TUDCA.
