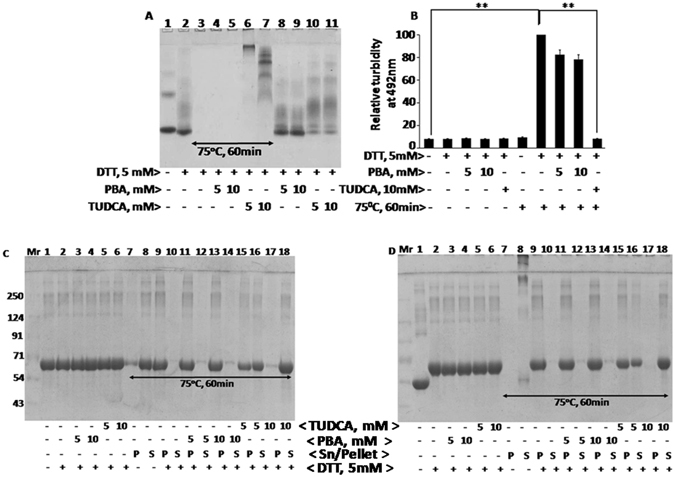
Figure 2.

Heat and DTT induced BSA aggregation in the presence of PBA or TUDCA: Panel A BSA samples were treated with or without heat at 75° C for 1 h in the presence and absence of 5 mM DTT and PBA or TUDCA (5 and 10 mM). BSA aggregation was analyzed by 8% Native-PAGE. Various lanes are as follows: 1, BSA; 2, BSA + DTT; 3, BSA + DTT + heat; 4, BSA + DTT + 5 mM PBA + heat; 5, BSA + DTT + 10 mM PBA + heat; 6, BSA + DTT + 5 mM TUDCA + heat; 7, BSA + DTT + 10 mM TUDCA + heat; 8, BSA + DTT + 5 mM PBA; 9, BSA + DTT + 10 mM PBA; 10, BSA + DTT + 5 mM TUDCA; 11, BSA + DTT + 10 mM TUDCA. Panel B represents turbidity assay to determine heat and DTT induced BSA aggregation in the presence and absence of different concentrations of PBA or TUDCA. Turbidity was measured at 492 nm by spectrophotometer. Panel C and D represents heat (75° C for 60 min) and 5 mM DTT induced aggregation of BSA in the presence and absence of PBA or TUDCA (5 and 10 mM). After treatments, BSA samples were spun at 10, 000 RPM for 10 minutes and the pellet (P) and supernatant (S) fractions were analyzed by 12% reducing (Panel C) or non-reducing SDS-PAGE (Panel D). Various lanes are: 1, BSA; 2, BSA + DTT; 3, BSA + DTT + 5 mM PBA; 4, BSA + DTT + 10 mM PBA; 5, BSA + DTT + 5 mM TUDCA; 6, BSA + DTT + 10 mM TUDCA; lanes 7, 9, 11, 13, 15, and 17 are pellet fractions of BSA + heat, BSA + DTT + heat, BSA + DTT + 5 mM PBA + heat, BSA + DTT + 10 mM PBA + heat, BSA + DTT + 5 mM TUDCA + heat, and BSA + DTT + 10 mM TUDCA + heat respectively; and lanes 8, 10, 12, 14, and 16 are supernatant fractions. Data shown in Panel B are mean ± SD, (n = 3). The asterisks represent statistically significant differences (*P < 0.05, **P < 0.01). P value is calculated by t-test.
