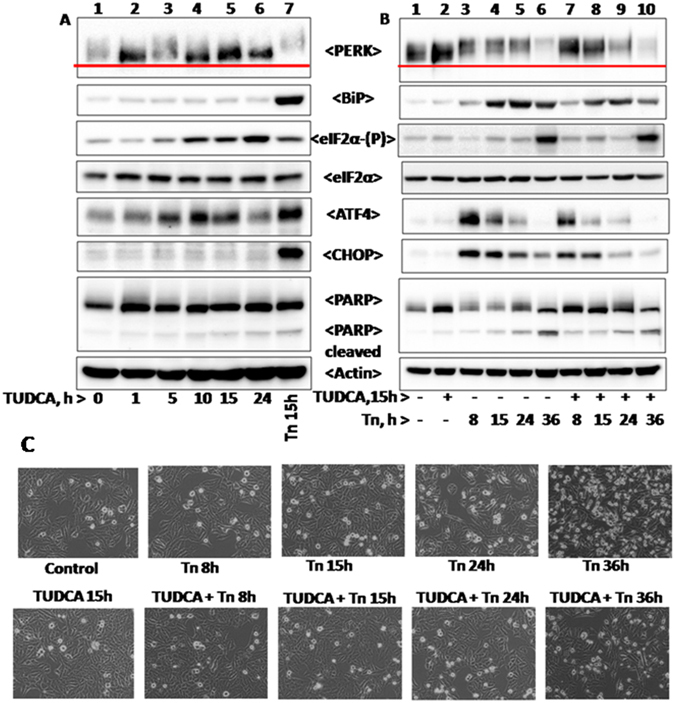
Figure 6.

Tunicamycin induced UPR and PARP cleavage in the presence of TUDCA: HepG2 cells were treated with12 µM tunicamycin, 2 mM TUDCA or with TUDCA and tunicamycin for different time periods as shown in the figure and were processed as described in Materials and Methods. Panel A represents time course analysis of different UPR marker proteins in cells treated with 2 mM TUDCA for indicated time periods. Panel B represents UPR status in cells pretreated with 2 mM TUDCA for 15 h and then incubated with 12 µM tunicamycin for different time periods (8, 15, 24, and 36 h) as indicated in the figure. Panel C represents morphology of HepG2 cells in response to corresponding treatments as mentioned in panel B.
