Figure 2.

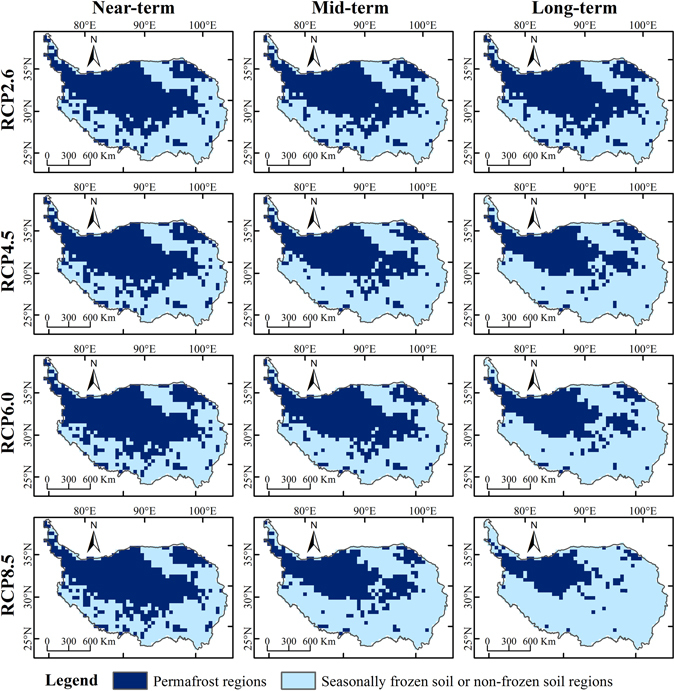
Permafrost distribution on the QTP in the near-term (2011–2040), mid-term (2041–2070) and long-term (2071–2099) under RCP2.6, RCP4.5, RCP6.0 and RCP8.5 scenarios. (The figure was created using ArcGIS 10.1 http://www.esri.com/ software).

Permafrost distribution on the QTP in the near-term (2011–2040), mid-term (2041–2070) and long-term (2071–2099) under RCP2.6, RCP4.5, RCP6.0 and RCP8.5 scenarios. (The figure was created using ArcGIS 10.1 http://www.esri.com/ software).