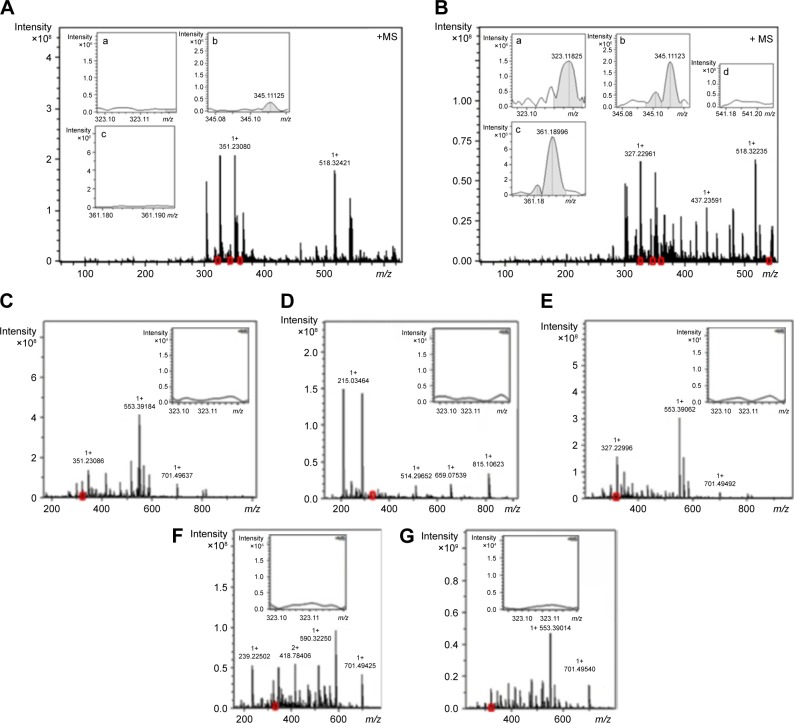
Figure 7.
ESI-MS spectra of the extracts of the tumor, brain, heart, spleen, liver, and kidney tissues of the S180 mice treated with 1 μmol/kg of ATIQCTPC for 10 consecutive days.
Notes: (A) ESI-MS spectrum of the extract of the tumor tissue of the S180 mice treated with 1 μmol/kg of ATIQCTPC for 10 consecutive days, a~c denote the MS area of ATIQCTPC-related peaks. (B) ESI-MS spectrum of the extract of the tumor tissue of the S180 mice treated with NS for 10 consecutive days, a~d denoted the MS area of ATIQCTPC-related peaks. (C) ESI-MS spectrum of the extract of the brain tissue of the S180 mice treated with 1 μmol/kg of ATIQCTPC for 10 consecutive days. (D) ESI-MS spectrum of the extract of the heart tissue of the S180 mice treated with 1 μmol/kg of ATIQCTPC for 10 consecutive days. (E) ESI-MS spectrum of the extract of the spleen tissue of the S180 mice treated with 1 μmol/kg of ATIQCTPC for 10 consecutive days. (F) ESI-MS spectrum of the extract of the liver tissue of the S180 mice treated with 1 μmol/kg of ATIQCTPC for 10 consecutive days. (G) ESI-MS spectrum of the extract of the kidney tissue of the S180 mice treated with 1 μmol/kg of ATIQCTPC for 10 consecutive days.
Abbreviations: ESI-MS, electrospray ionization mass spectrometry; ATIQCTPC, (6S)-3-acetyl-4-oxo-N-(2-(3,4,5,6-tetrahydroxytetrahydro-2H-pyran-2-carboxamido) ethyl)-4,6,7,12-tetrahydroindolo[2,3-a]quinolizine-6-carboxamide; NS, normal saline.

