
Figure 2.
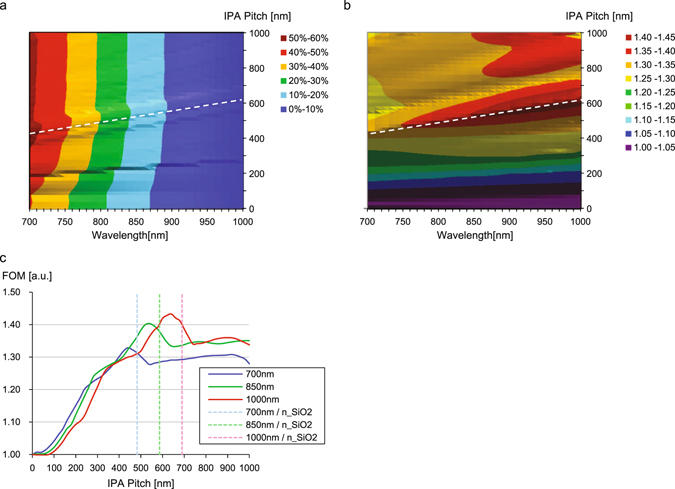
(a) Amount of light absorption of semi-infinite c-Si substrate with IPA by FDTD simulation. The horizontal axis is the wavelength of the incident light. The vertical axis is the pitch of IPA. Color indicates amount of the absorption of the c-Si which integrated from the surface to 3 μm depth. (b) Normalized amount of light absorption (Figure of Merit) which is divided by the amount of absorption with flat surface case (corresponding to 0 nm pitch). White dashed lines in panels (a) and (b), the local maximum at each wavelength, slightly depends on the wavelength. (c) Vertical cuts of (b) at the wavelengths of 700 nm, 850 nm and 1000 nm. Light colored dashed lines are the effective wavelengths in SiO2. Here, the refractive index is assumed to 1.45.