
Figure 8.
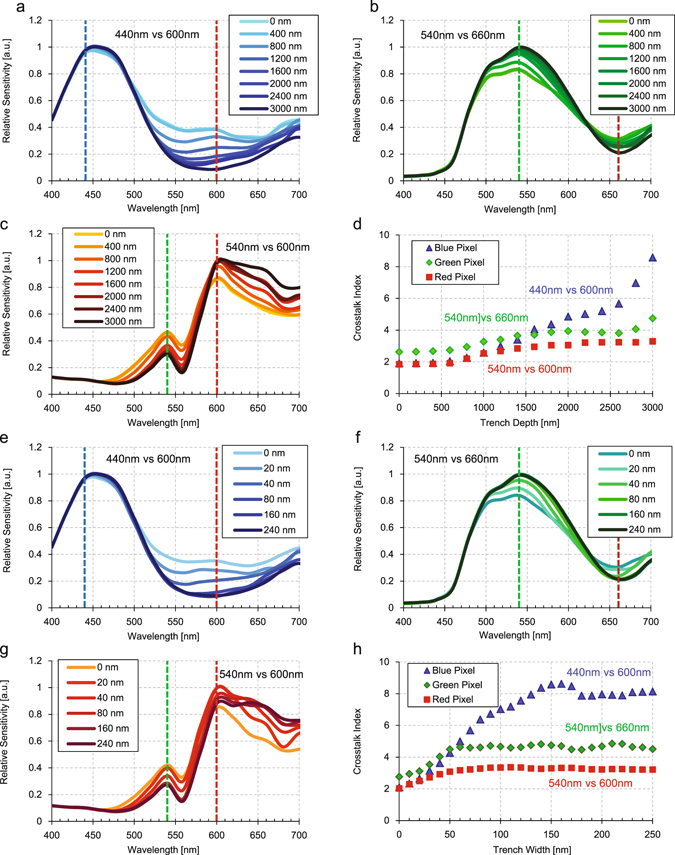
(a–c) These panels show the simulated spectral sensitivities of RGB pixels of sample C changing DTI depth from 0 nm (without DTI) to 3000 nm (DTI penetrate the substrate) in steps of 400 nm. (a) Shows the spectral sensitivity of blue pixel, (b) is that of green pixel, and (c) is that of red pixel. (d) This panel shows the spectral color ratio as index of photonic color crosstalk to adjacent pixels. Blue triangles are the ratio between 440 nm and 600 nm in blue pixel from (a), green diamonds are the ratio between 540 nm and 660 nm in green pixel from (b), and red squares are the ratio between 600 nm and 540 nm in red pixel from (c). (e–g) Show the same simulation results but changing DTI width from 0 nm to 240 nm with fixed depth of 3000 nm. (e) is for the blue pixel, (f) is for the green pixel, and (g) is for the red pixel. (h) This panel shows the spectral color ratio derived from (e–g) plotted in same fashion as panel (d).