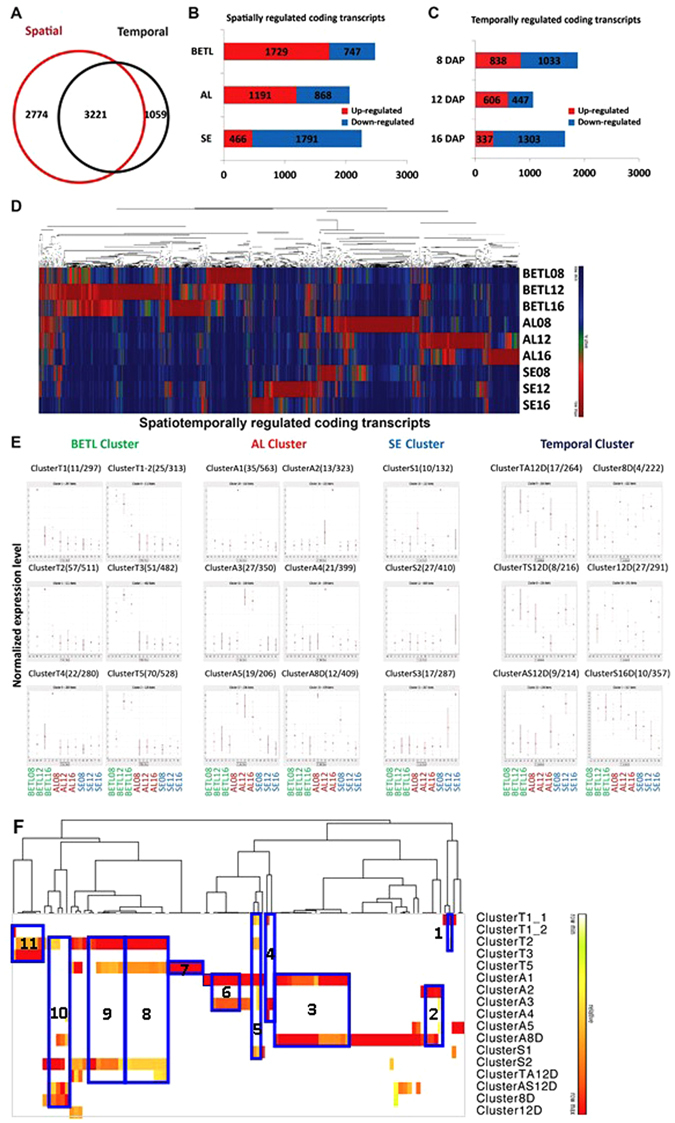
Figure 2.

Differential expression of coding transcripts during endosperm development. (A) Coding transcripts with FPKM >1.0 and with more than 4-fold expression-level changes were analysed; the overlap between spatially and temporally regulated are shown. (B) The numbers of coding transcripts that were up- or down-regulated more than 4 fold in any tissue are shown in box graphs. (C) The numbers of coding transcripts that were up- or down-regulated more than 4 fold at any DAP are shown in box graphs. (D) Hierarchical cluster analysis of spatio-temporally regulated coding transcripts. (E) SOM clusters are depicted based on clustering patterns. Given in parentheses is the number of co-expressed transcription factors and the number of genes that belong to each SOM cluster. The relative level of transcript is plotted on the y axis for each of nine samples: BETL08, BETL12, BETL16, AL08, AL12, AL16, SE08, SE12, and SE16 from left to right. (F) Functional GO-term enrichment. Significance is represented by heat map (-log10 P-value; red – high/white – low). Representative functional categories correspond to numbers on graph as follows: 1, defence response; 2, oxoacid metabolic process (oxidation reduction); 3, macromolecular complex subunit organization (chromatin assembly or disassembly, nucleosome assembly, protein-DNA packing); 4, lipid biosynthesis processes; 5, response to stimulus and stress; 6, response to abiotic stimulus and biotic stress (temperature); 7, microtubule-based process; 8, post translational process (phosphorylation, protein modifications); 9, regulation of metabolic/biosynthesis process; 10, regulation of transcription process; 10, macromolecule biosynthesis process; 11, establishment of localization.
