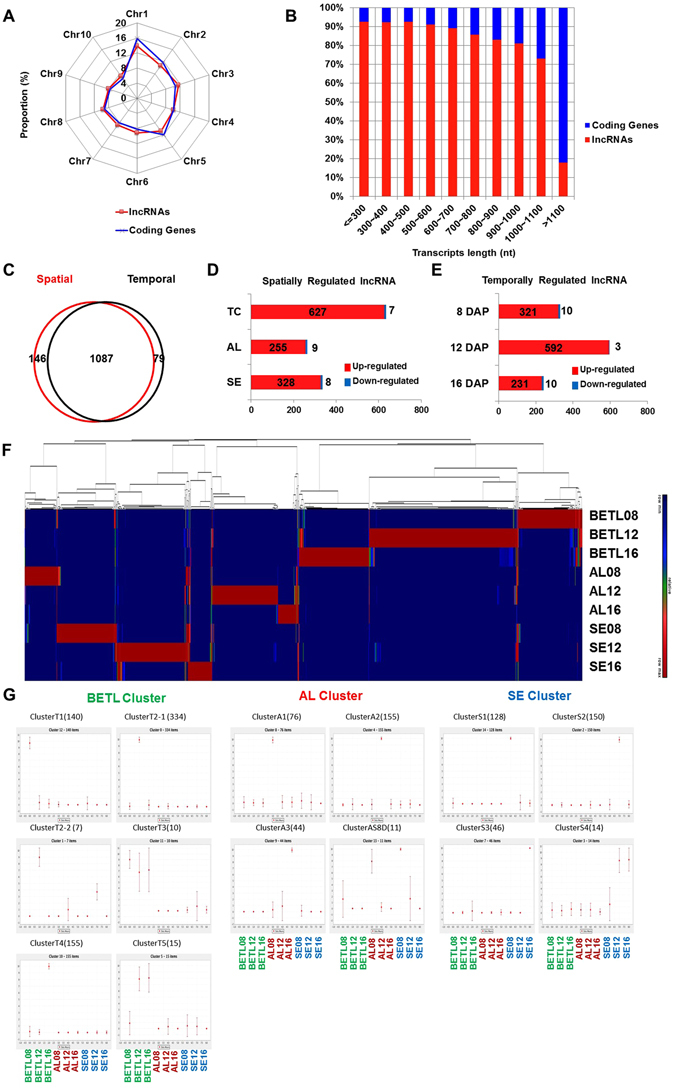
Figure 3.

Identification of long noncoding RNAs in the maize endosperm. (A) Distribution of lncRNAs along each chromosome. The proportion of coding transcripts and lncRNAs for each chromosome. (B) Size distributions of lncRNAs and coding transcripts. (C) Venn diagram of the number of spatially and/or temporally regulated lncRNAs with FPKM >0.01 and more than 4-fold expression-level changes. (D) The numbers of lncRNAs up- or down-regulated more than 4-fold in any tissue are shown. (E) The numbers of lncRNAs up- or down-regulated more than 4 fold at any DAP are shown. (F) Hierarchical cluster analysis of spatio-temporally regulated lncRNAs. (G) SOM clusters depicted based on clustering patterns. In parentheses are the number of co-expressed transcription factors and the number of genes that belong to each SOM cluster. The relative level of transcript is plotted on the y axis for each of nine samples: BETL08, BETL12, BETL16, AL08, AL12, AL16, SE08, SE12, and SE16 from left to right.
