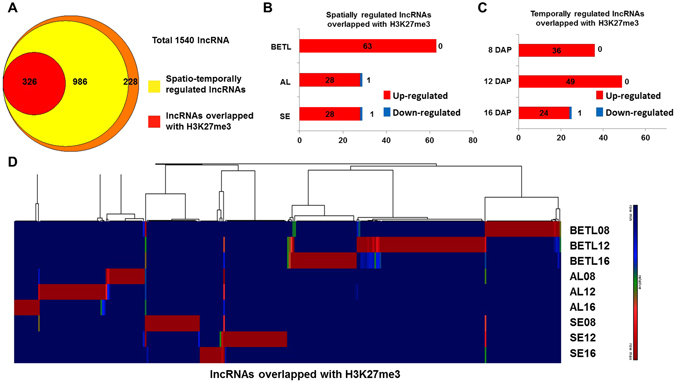
Figure 4.

Spatio-temporally regulated lncRNA loci overlap with H3K27me3-marked loci. (A) Venn diagram representing the overlap between H3K27me3-enriched loci and spatio-temporally regulated lncRNA transcription sites. (B) The numbers of lncRNAs that overlap with H3K27me3 enriched loci that are up- or down-regulated more than 4-fold at any tissue are shown. (C) The numbers of lncRNAs that overlap with H3K27me3-enriched loci that were up- or down-regulated more than 4 fold at any DAP are shown. (D) Hierarchical cluster analysis of spatio-temporally regulated lncRNAs that overlap with H3K27me3-enriched loci.
