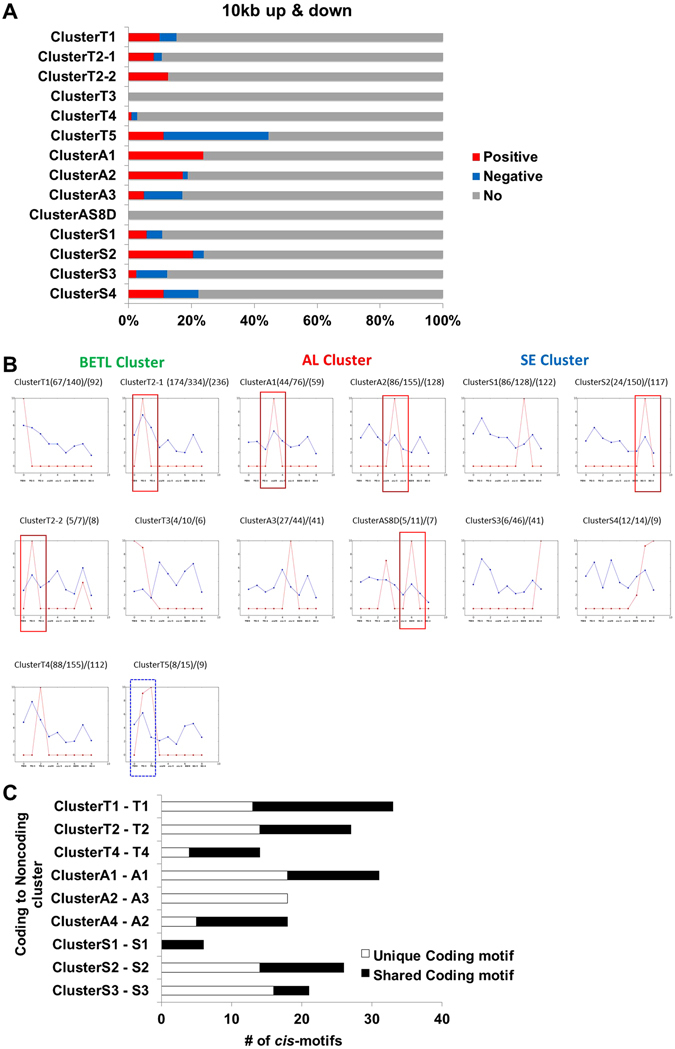
Figure 5.

Co-regulatory relationships between noncoding and coding transcripts. (A) Correlations between expression of lncRNA and neighbouring coding genes within 10 kb upstream and downstream of lncRNAs transcript loci were calculated for lncRNAs in each cluster. (B) The median value of an expression of lncRNAs and their neighbouring coding genes in each cluster. The relative level of transcript is plotted on the y axis for each of nine samples: BETL08, BETL12, BETL16, AL08, AL12, AL16, SE08, SE12, and SE16 from left to right. Blue lines plot data for coding genes and red lines lncRNAs. Red boxes indicate positive correlations and blue box indicates negative correlation. (C) The number of enriched cis-regulatory modules between each SOM cluster of lncRNAs and coding genes showing similar expression patterns.
