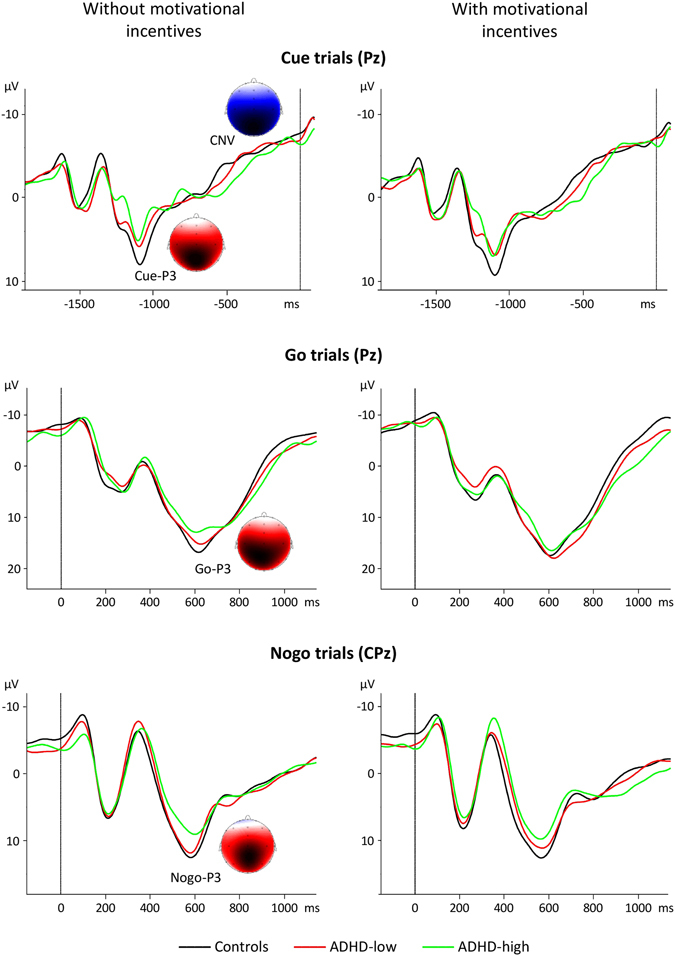
Figure 1.

Grand average event-related potentials for boys with FBB-ADHS total scores ≤0.5 (controls; black curves), boys with FBB-ADHS total scores >0.5 and ≤1 (ADHD-low; red curves) and boys with FBB-ADHS total scores >1 (ADHD-high; green curves). Top: ERPs following cue stimuli (electrode Pz), middle: ERPs following go stimuli (electrode Pz), bottom: ERPs following nogo stimuli (electrode CPz). Signals obtained for the without-incentives (resp. with-incentives) condition are shown on the left (resp. right) side. Time point 0 ms refers to the onset of the S2 stimulus. Topographies of Cue-P3, CNV, Go-P3 and Nogo-P3 in the control group for the without-incentives condition are also depicted. Blue and red colours indicate negative and positive amplitude values, respectively.
