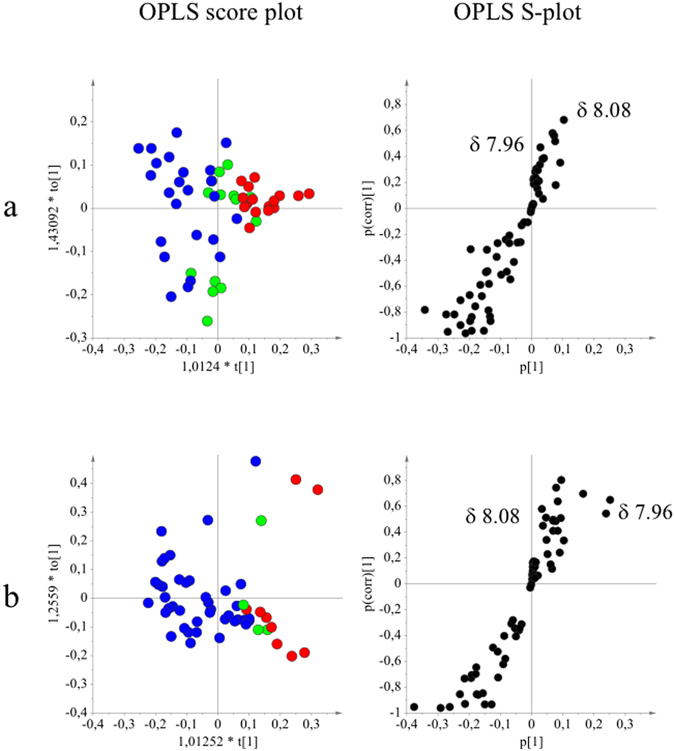
Figure 2.

Orthogonal partial least squares modeling applied to 1H-NMR data and potentiating activity of Cytisus striatus samples (Fig. 2). OPLS score- and S-plots obtained from the potentiating activity (1: indifferent  , 2: additive
  and 3: potentiation effect
  ) and 1H-NMR data in the range of the region between δ 6.00 and 8.60 of the different classes of potentiating activity of extracts of C. striatus on ciprofloxacin (a) and erythromycin (b). The sample preparation and extraction conditions were performed as shown in Supplementary Table 2.
