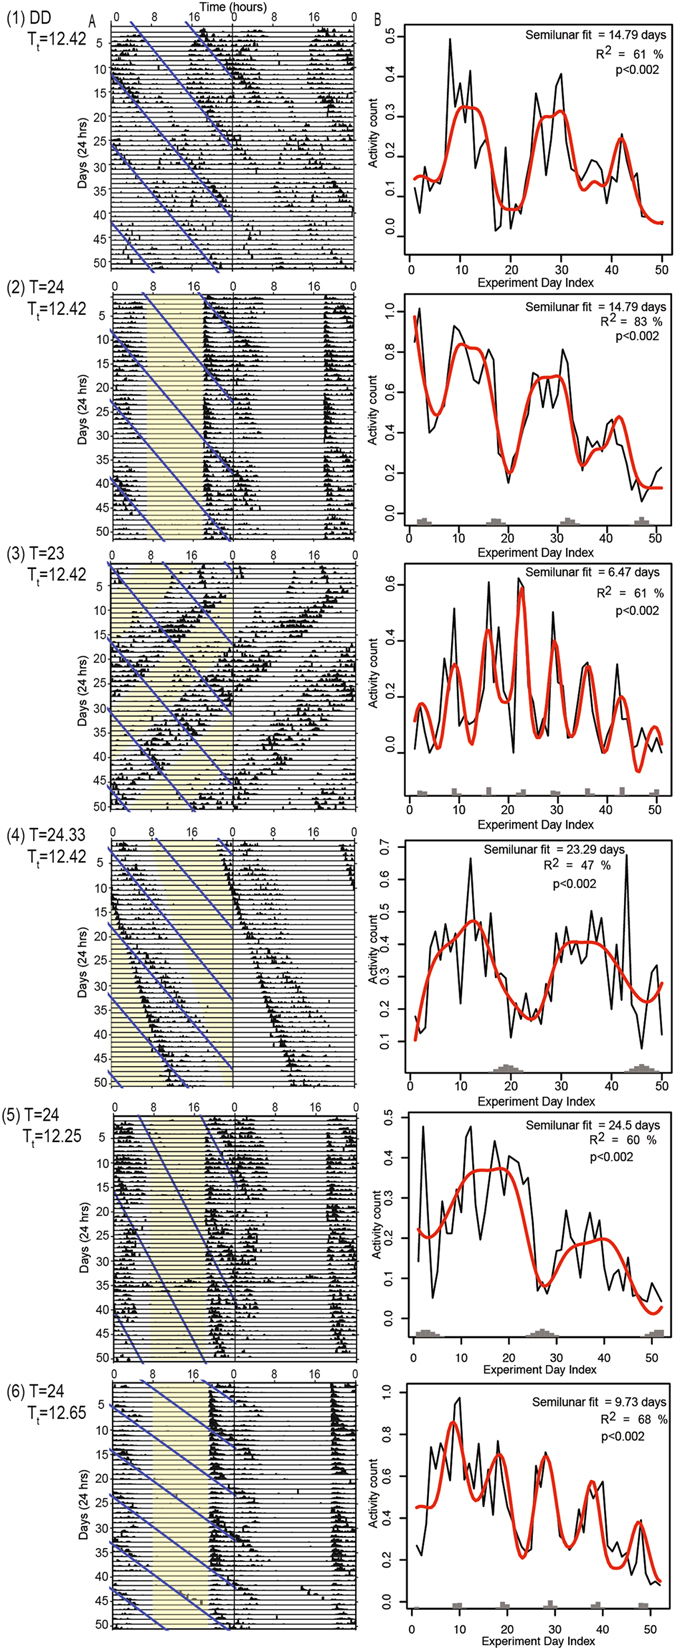
Figure 2.

Behaviour of Scyphax ornatus in six test experiments (rows 1–6). (1) Constant darkness, n = 20; (2) T = 24 hours, n = 25; (3) T = 23 hours, n = 20; (4) T = 24.3 hours, n = 18; (5) Tidal T = 12.25 hours, n = 19; (6) Tidal T = 12.65 hours, n = 20. Column (A) shows double plotted activity plots (actograms). The actograms represent the combined total of the normalized individuals (see Supplementary Information S2 for all individual actograms). Black bars indicate activity. The lights and tide signals are shown in yellow and blue, respectively, on the left-hand panel only. Column (B) indicates the model fit with the beats-predicted period. The black line indicates the observed amount of Scyphax activity in the analysis window per night. The red line shows the model fit. Grey bars represent nights when the tidal signal coincided with the analysis window; heights of bars indicate the duration of coincidence. (See also S1 for periodogram analysis of the shorter period circatidal and circadian rhythms in the data).
