
Figure 3.
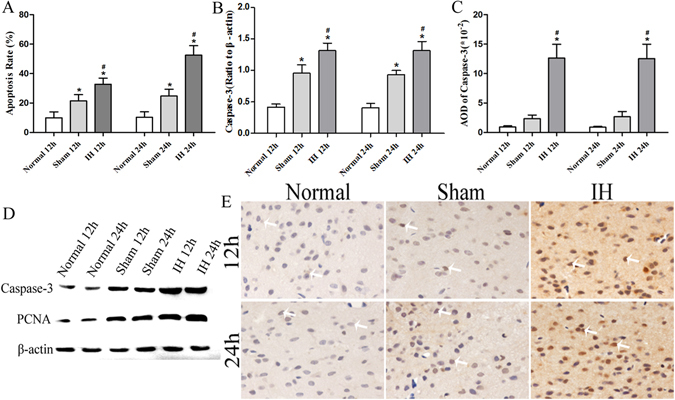
The apoptosis rate and caspase-3 levels of rats’ hypothalamic neuroendocrine cells at 12 h and 24 h. (A) Shows the apoptosis rate of rat hypothalamic neuroendocrine cells after modeling for 12 h and 24 h. (B) Shows the Caspase-3 levels of rat hypothalamic neuroendocrine cells after modeling for 12 h and 24 h (Western blot). (C) Shows AOD of Caspase-3. (D) Shows the tissue lysates for protein extraction were prepared and the total protein of each lysate was equalized for Western blot analysis. Proteins were detected by specific antibodies to Caspase-3 and PCNA. β-actin was used as a loading control. (E) Shows immunostaining of Caspase-3 (×400). *P < 0.05 vs Normal 12 h (24 h), # P < 0.05 vs Sham 12 h (24 h).