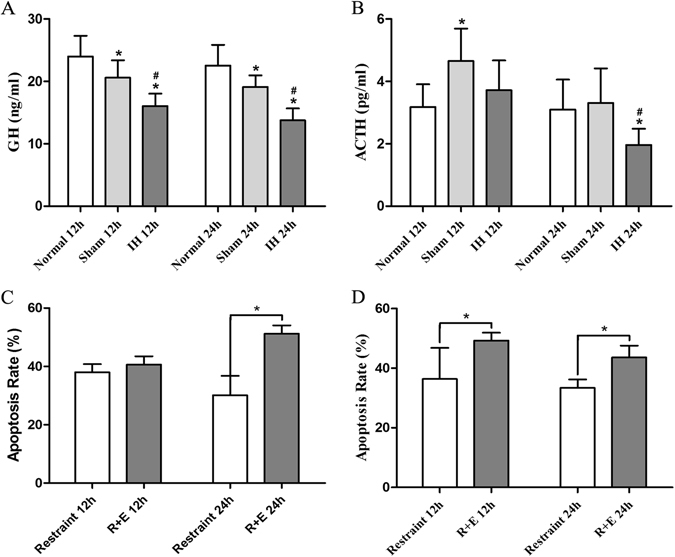
Figure 8.

The rat serum GH and ACTH concentrations and the apoptosis rates of rabbit hypothalamic and hypophyseal neuroendocrine cells at 12 h and 24 h. (A) Shows GH concentrations after modeling for 12 h and 24 h. (B) Shows ACTH concentrations after modeling for 12 h and 24 h. *P < 0.05 vs Normal 12 h (24 h), # P < 0.05 vs Sham 12 h (24 h). *P < 0.05. (C) Shows the apoptosis rate of rabbit hypothalamic neuroendocrine cells at 12 h and 24 h. The apoptosis rate of the hypothalamus in the Normal group was 0%. (D) Shows the apoptosis rate of rabbit hypophyseal neuroendocrine cells at 12 h and 24 h. The apoptosis rate of hypophyseal neuroendocrine cells in Normal group was 0%. *P < 0.05.
