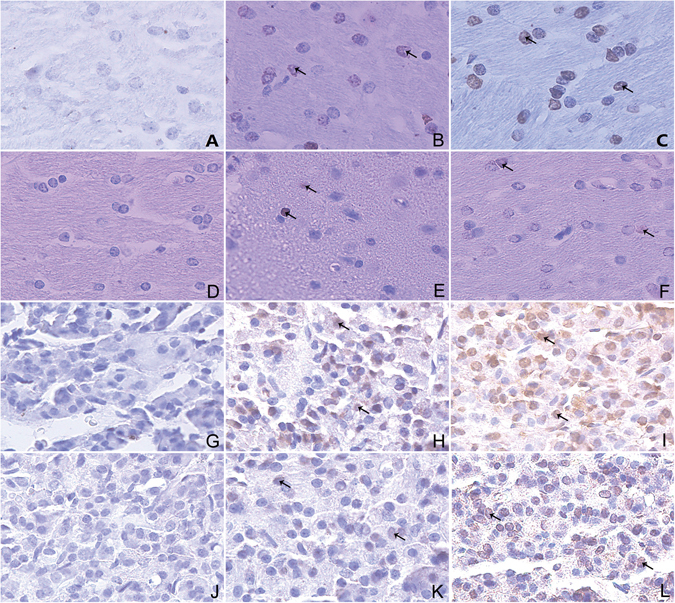
Figure 9.

The immunohistochemistry images show apoptosis of rabbit hypothalamic and hypophyseal neuroendocrine cells at 12 h and 24 h (×400). (A–F) Show the apoptosis of rabbit hypothalamic neuroendocrine cells at 12 h and 24 h. (G–L) Show the apoptosis of rabbit hypophyseal neuroendocrine cells at 12 h and 24 h. (A,G) Show Normal 12 h. (B,H) Show Restraint 12 h. (C,I) Show R + E group 12 h. (D,J) Show Normal 24 h. (E,K) Show Restraint 24 h. (F,L) Show R + E 24 h. The arrows in the panels show the apoptotic cells.
