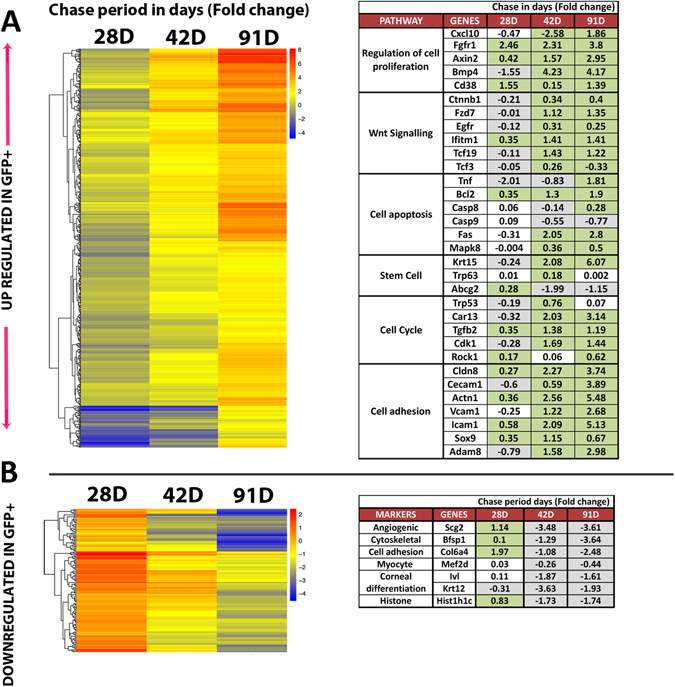
Figure 3.

RNA-Seq analysis of GFP+ LRCs and GFP− corneal epithelial cells from K5tTA × TRE-H2BGFP highlights the up-regulated and down-regulated genes in GFP+ LRCs over time. (A) Heatmap of 651 up regulated genes in GFP+ LRCs showing differences in gene expression between GFP− and GFP+ cells represented in a single column at each chase period. The colors of the heat map representing single genes changing from blue to red across the chase periods indicate enrichment of gene expression in GFP+ LRCs. The table enlists pathways and genes involved in stem cell activation, maintenance and proliferation in GFP+ LRCs. (B) Heatmap of 135 down regulated genes in GFP+ LRCs. Blue represents low expression in GFP+, and red high expression in GFP+. The table indicates key genes involved in cell division and differentiation. Highlighted green boxes in the table represent significant high expression in GFP+ LRCs; Grey boxes represent significant high expression in GFP− cells; No color indicates no significant difference between GFP+ and GFP− cornea cells.
