
Figure 2.
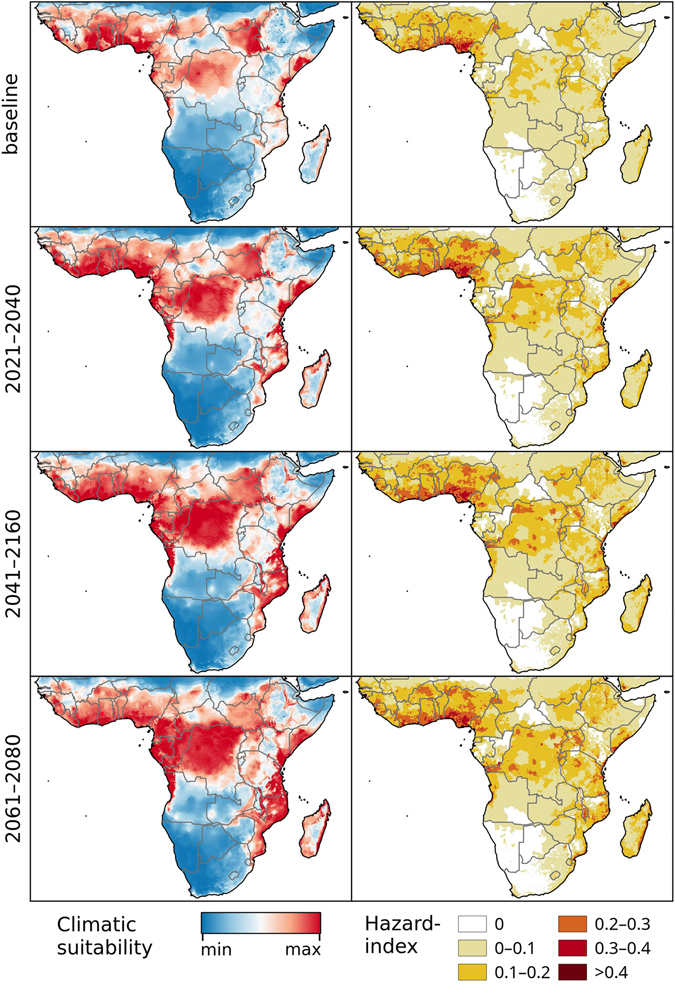
Chikungunya under the baseline and RCP 8.5 climate change scenarios in Africa. Left: Climatic suitability, right: hazard index. Climate change scenarios represent the mean model output obtained through the 5 GCMs. Climatic suitability output is scaled to the over-all global minimum (0) and maximum (0.623) values observed in any model. Maps were generated using the “raster” package in R 3.3.2 (https://www.r-project.org/) and QGIS 2.8.1 (https://www.qgis.org/).