
Figure 2.
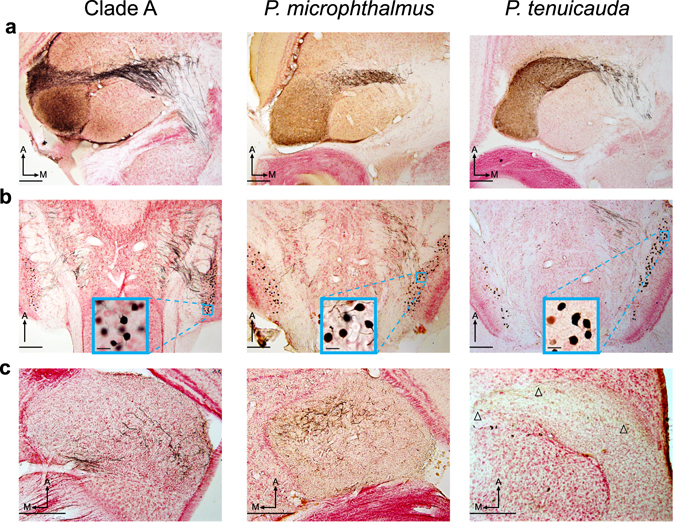
Neurons from the hindbrain nELL project bilaterally to the midbrain in all three lineages. Iontophoretic injections of neuronal tract tracers in the left ELa of a clade-A species (B. niger, left) and P. microphthalmus (center), and in the anterior end of the left EL in P. tenuicuda (right) labeled axonal projections through the lateral lemniscus (a) and backfilled somas in the left and right hindbrain nELL (b). The majority of backfilled neurons were in the right nELL in the three lineages (Clade A: B. brachyistius n = 61stained cells total, 60% contralateral; B. niger subject 1: n = 494, 67% contralateral; B. niger subject 2: n = 559, 69% contralateral; B. niger subject 3: n = 308, 64% contralateral; G. petersii: n = 204, 67% contralateral. P. microphthalmus subject 1: n = 156 stained cells total, 59% contralateral; P. microphthalmus subject 2: n = 481, 68% contralateral. P. tenuicauda subject 1: n = 10 stained cells total, 70% contralateral; P. tenuicauda subject 2: n = 523, 71% contralateral; P. tenuicauda subject 3: n = 21, 75% contralateral). (c) Stained axonal projections in the right ELa and anterior end of the right EL show that some projections from the hindbrain are bilateral. Insets in (b) show close-ups of stained somas of nELL neurons contralateral to the injection site. All photomicrographs are from 50-µm horizontal sections of the brain. Scale bars in the insets in (b) represent 20 µm; all other scale bars represent 200 µm. Arrowheads point to labeled axonal projections in the contralateral EL of P. tenuicauda. All photomicrographs were taken from the same subject in each lineage. The injection sites are not visible in these sections. With respect to the photomicrographs in (a), injection sites were: 250 µm dorsal and towards the lateral edge of ELa in clade A; 400 µm dorsal and towards the anterior edge of ELa in P. microphthalmus; 250 µm dorsal and towards the anterolateral edge of EL in P. tenuicauda. A: anterior. M: medial.