Figure 5.

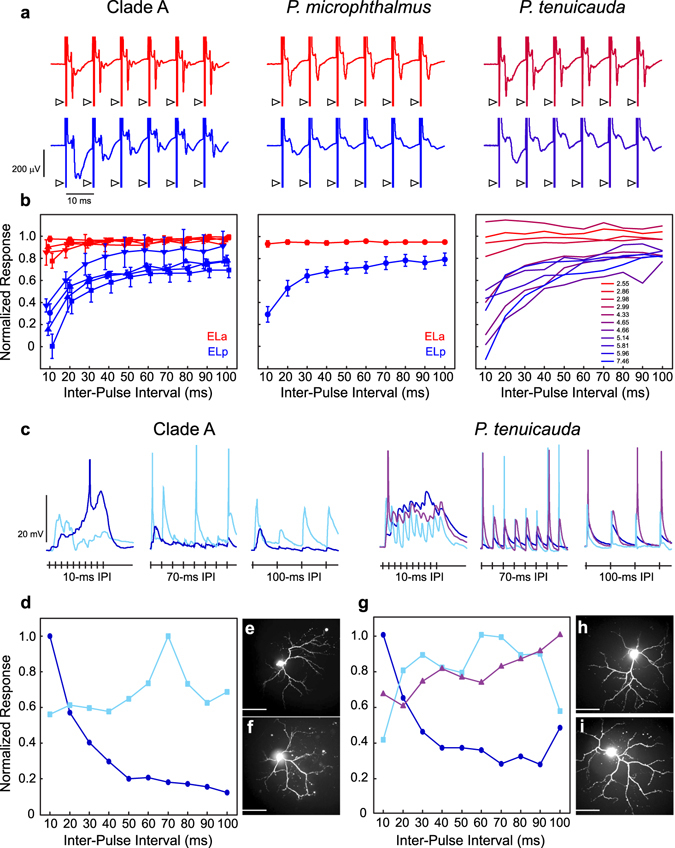
Inter-pulse interval processing arises in ELp of clade-A species and P. microphthalmus, and in the posterior end of EL in P. tenuicauda. (a) Representative mean evoked potentials (n = 10 traces) from ELa (red) and ELp (blue) of clade A (left) and P. microphthalmus (center), and towards the anterior (top) and posterior (bottom) ends of EL in P. tenuicauda (right), obtained in vivo in response to electrosensory pulse trains with inter-pulse intervals of 10ms. Arrowheads denote stimulus artefacts. (b) We averaged the peak-to-peak amplitude of the evoked potential in response to the second through tenth pulses of the stimulus and normalized it to the peak-to-peak amplitude of the evoked potential in response to the first pulse of the stimulus (see Methods). For clade A (left) and P. microphthalmus (center), we normalized responses separately for ELa (red symbols) and ELp (blue symbols) and figure symbols represent the mean normalized amplitude and the error bars represent the SEM. The amplitude of evoked potentials attenuates at short IPIs in ELp, but not ELa, of clade-A species (B. brachyistius: squares, n = 6, F9,95 = 4.29, p < 0.001; B. niger: triangles, n = 4, F9,57 = 11.29, p < 0.0001; P. adspersus: circles, n = 3, F9,38 = 11.93, p < 0.0001; G. petersii: inverted triangles, n = 3, F9,38 = 2.00, p = 0.06) and P. microphthalmus (n = 6, F9,95 = 10.80, p < 0.0001). In EL of P. tenuicauda, evoked potentials attenuate towards the posterior end of EL, but not towards the anterior end. For P. tenuicauda, the color code represents the latency (in ms) to the first negative peak of the evoked potential in response to a 0.5-ms bipolar square pulse, from the shortest latency in red to the longest in blue. These latencies span those previously reported in ELa and ELp of clade-A species (ELa: 3.7 ms, ELp: 8.2 ms) and P. microphthalmus (ELa: 2.8 ms, ELp: 7.4 ms)21. (c) Representative response traces of neurons sensitive to inter-pulse intervals in ELp of B. niger (left) and the posterior end of EL in P. tenuicauda (right). In vitro whole-cell recordings were obtained in response to electrical stimulation of the lateral lemniscus. Traces depict responses to pulse trains with IPIs of 10ms, 70 ms, and 100 ms. Based on the tuning curves (d,g, see Methods), neurons were classified as high-pass (dark blue), band-pass (light blue), and low-pass (purple). Neurons sensitive to IPIs in B. niger (e,f) and P. tenuicauda (h,i) are morphologically similar and highly dendritic, as evidenced by confocal fluorescence imaging (see Methods). Scale bars in photomicrographs represent 50 µm.
