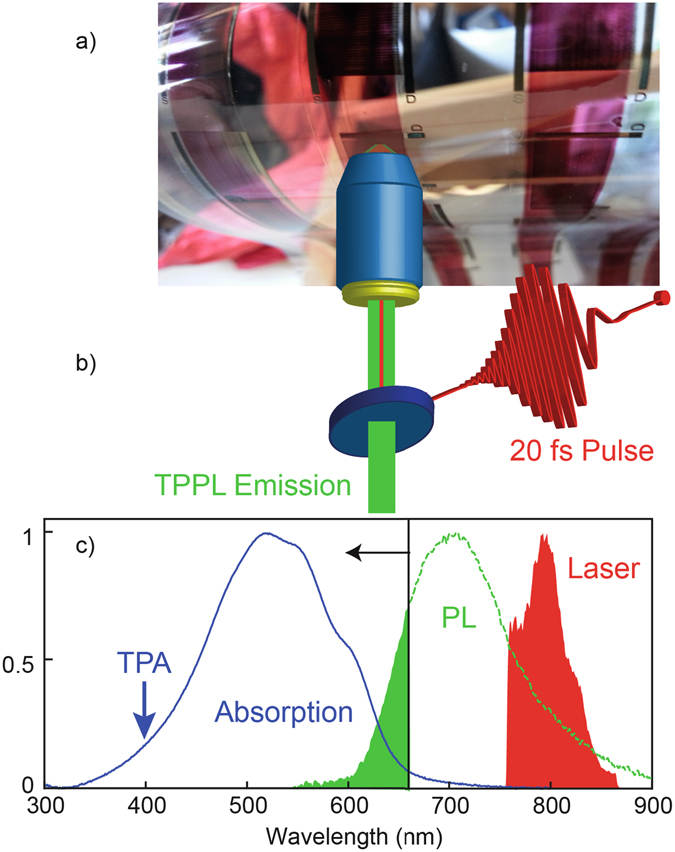
Figure 1.

Non-linear optical characterization of a polymer semiconductor material roll coated on a flexible substrate. (a) Image of the flexible PET substrate with R2R printed source and drain silver electrodes covered by P3HT polymer semiconductor stripes. (b) Schematic of the non-linear optical microscope. (c) Absorption spectrum of P3HT (blue curve), emission spectrum of P3HT (green curve) and excitation laser spectrum (red coloured region). The green coloured region represents the amount of photoluminescence from P3HT detected in the experiment, considering that a 670 nm short pass filter is used. The blue arrow represents the effective wavelength at which the two-photon absorption occurs.
