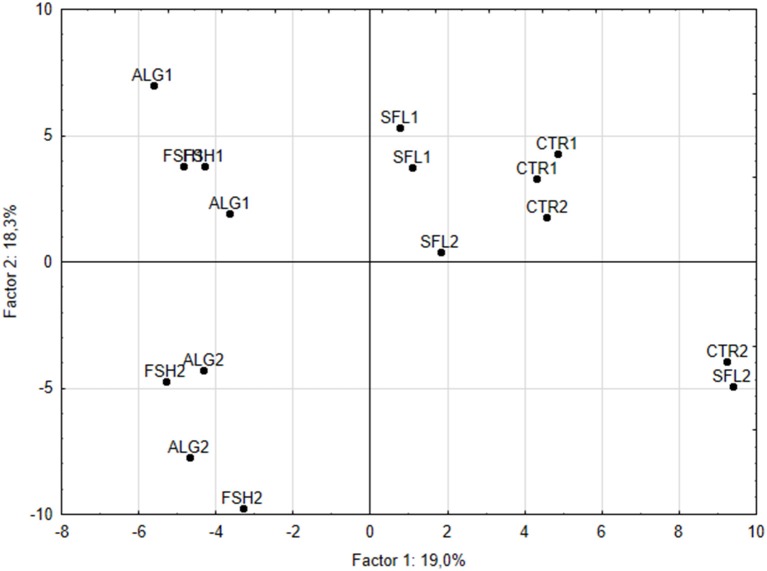
Figure 2.
Principal components plot derived from the analysis of T-RFLP data showing the discrimination along principal components 1 and 2 of RUSITEC bacterial communities provided with either control diets (CTR) or diets supplemented with 2% sunflower oil (SFL) oil, sunflower oil with 1% fish oil (FSH) or sunflower oil and 1% marine algae (ALG). The number after the treatment code indicates the RUSITEC system (there were two RUSITEC systems and two replicates of each treatment in each system).

