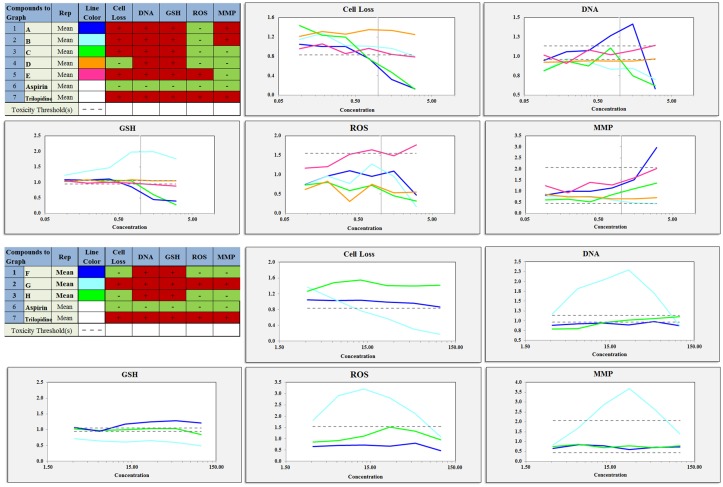
FIGURE 5.
Various concentrations of the components and extracts inhibited cell proliferation, DNA damage, GSH levels, ROS levels, mitochondrial membrane potential changes in proliferating cells. A, total extract; B, Water fraction; C, 30% ethanol fraction; D, 70% ethanol fraction; E, DCM fraction; F, TSG; G, EDG; H, Emodin.

