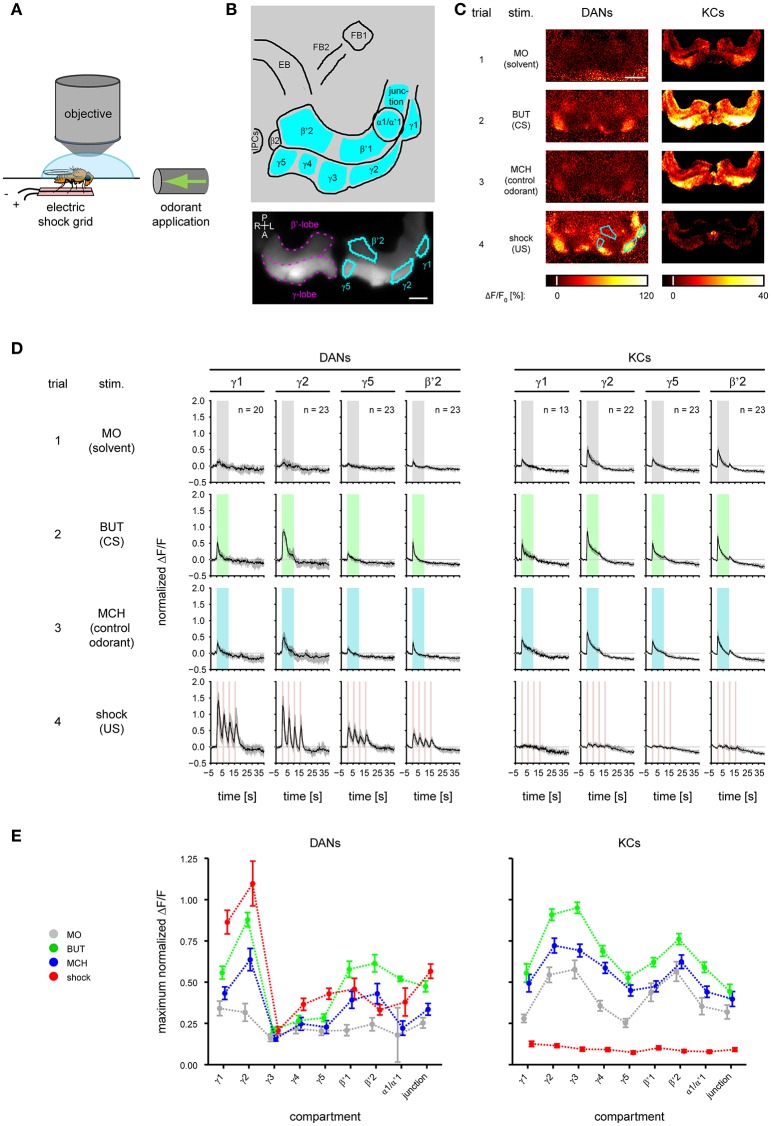
Figure 2.
Odorant- and electric shock-induced responses in dopaminergic neurons (DANs) and Kenyon cells (KCs) differ between mushroom body (MB) compartments. (A) During calcium imaging electric foot shock and odorants were applied to the fly. (B) Top: schematic view of the analyzed regions. FB, fan-shaped body; EB, ellipsoid body; IPCs, insulin-producing cells. Nine MB compartments (indicated by cyan) were analyzed in both KCs and DANs. Bottom: DsRed raw fluorescence image with the MB β'- and γ-lobe (magenta) indicated in the right brain hemisphere. Four exemplary MB compartments γ1, γ2, γ5, and β'2 (cyan) are indicated in the left hemisphere. Dorsal view; P, posterior; L, left; A, anterior; R, right. Scale bar: 40 μm. (C) Color-coded activity patterns obtained for stimulations with odorants and electric shock in DANs (TH>GCaMP3 fly) and KCs (OK107>GCaMP3 fly) in the unpaired group prior to training (trial 1–4). The four exemplary MB compartments are identical to those in (B). Scale bar: 80 μm. (D) Response traces obtained for stimulation with odorants and electric shock in DANs and KCs in γ1, γ2, γ5, and β'2. Traces are normalized to the strongest response amplitude induced by the first BUT (CS) presentation in any region of interest, and show the median and quartiles over all flies in the unpaired group [number of flies (n) is indicated in the figure]. (E) Maximum response obtained for stimulation with odorants and electric shock in DANs and KCs in nine compartments. All curves represent the mean and SEM, n = 2–23.

