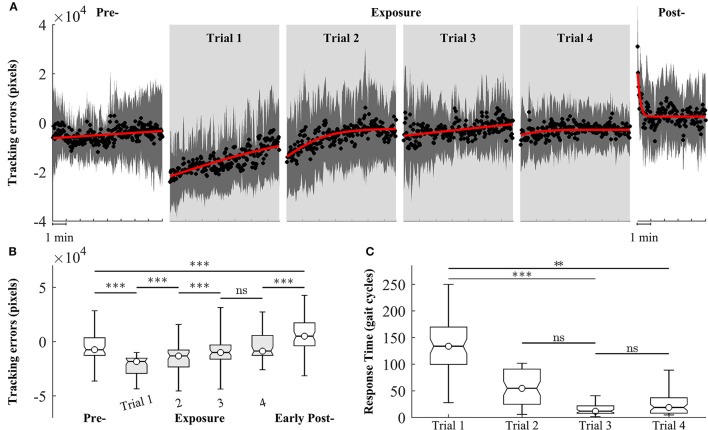
Figure 6.
Group averages of tracking errors across 4 trials of training, gray areas represent early exposure period. (A) Black circles represent mean of tracking errors across subjects, and shaded areas indicate one standard deviation. Solid lines are fitting curves using a sigmoidal model. (B,C) Statistical analysis of tracking errors and response time using multiple comparison test with Tukey-Kramer adjustment, respectively. **P < 0.01 and ***P < 0.001. ns, non-significant.

