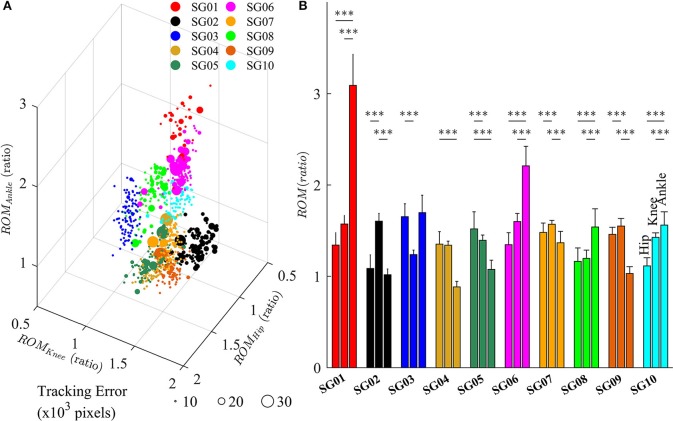
Figure 7.
(A) Variations of lower limb joint angles (hip, knee, and ankle) in the right leg for 10 subjects in late-exposure (Trial 4). The size of the symbols represents the tracking error. (B) ROM ratio is the proportion of range of motion in late-exposure compared to pre-exposure. Post-hoc analyses using multiple comparison with Tukey-Kramer adjustment. ***P < 0.001.

