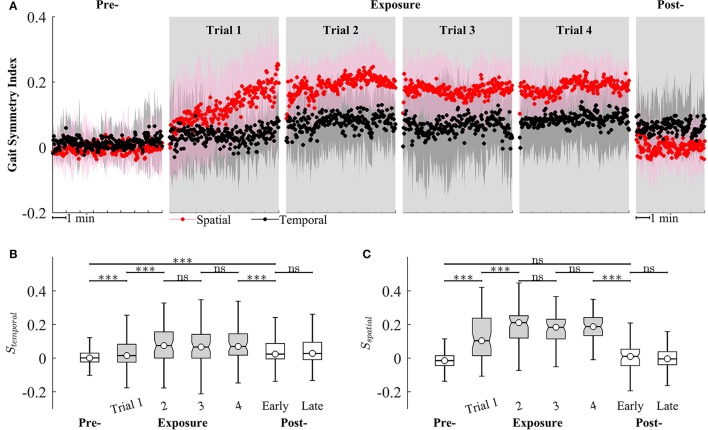
Figure 9.
(A) Group averages of gait symmetry indices across 4 trials of training. Black and red circles represent mean values of temporal and spatial gait symmetry indices, respectively. Shaded areas indicate one standard deviation. (B,C) Statistical analysis for gait symmetry index in the temporal (Stemporal), and spatial (Sspatial) domain using multiple comparison with Tukey-Kramer adjustment. ***P < 0.001, ns, non-significant. Box plots in gray represent exposure period.

