
Figure 3.
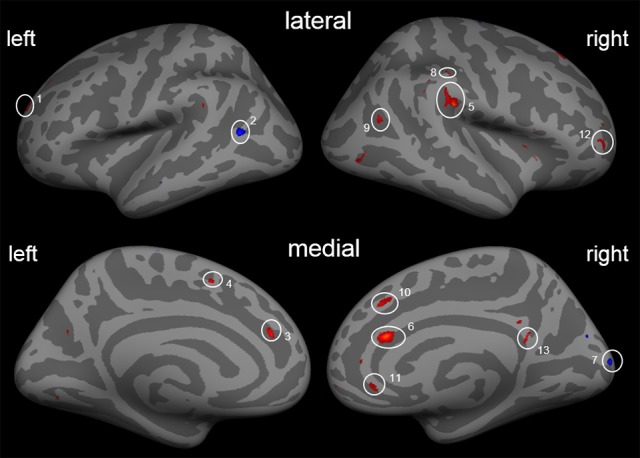
Cortical thickness differences due to the training with the covariate ΔVAS. Inflated presentation of a standardized brain. Areas shown in blue are regions with decrease in cortical thickness after the training. Red areas mark an increase in cortical thickness. Only areas with a vertex-wise threshold of p > 0.05 are shown. 1, superior frontal; 2, middle temporal cortex; 3, anterior cingulate cortex; 4, inferior frontal; 5, SII/Insula; 6, anterior cingulate cortex; 7, occipital cortex; 8, post-central sulcus; 9, middle temporal cortex; 10, superior frontal cortex; 11 and 12, dorsolateral prefrontal cortex; 13, posterior cingulate cortex.