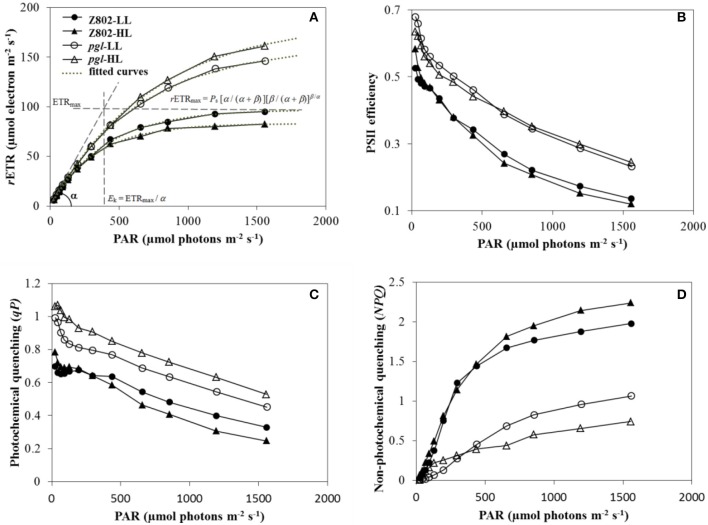
Figure 6.
(A) Rapid light curves (RLC) of Z802 and pgl under high (HL) and low light treatment (LL). The relative electron transport rate (rETR) is plotted against PAR irradiance (μmol photons m−2 s−1). Fitted curves are plotted with a dotted line, and the rETRmax, Ek, and α are displayed in the RLCs of Z802 under LL. (B) PSII efficiency (ΦPSII), (C) photochemical quenching (qP), and (D) non-photochemical quenching (NPQ) derived from the RLCs under high (HL) and low light (LL) in Z802 and pgl as a function of PAR.

