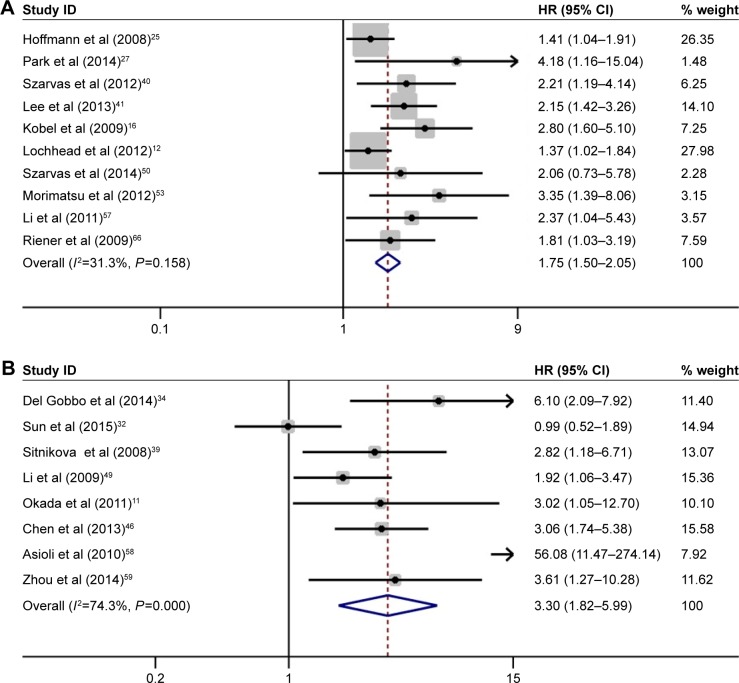
Figure 4.
Forest plot of studies evaluating HRs of high IMP3 expression in solid tumors for CSS and DFS.
Notes: (A) High IMP3 expression was associated with poor CSS in solid tumors (HR =1.75, 95% CI: 1.50–2.05, P<0.001). (B) High IMP3 expression was associated with poor DFS in solid tumors (HR =3.30, 95% CI: 1.82–5.99, P<0.001). Weights are from random-effects analysis.
Abbreviations: CI, confidence interval; CSS, cancer-specific survival; DFS, disease-free survival; HRs, hazard ratios; IMP3, insulin-like growth factor II mRNA-binding protein 3; OS, overall survival.

