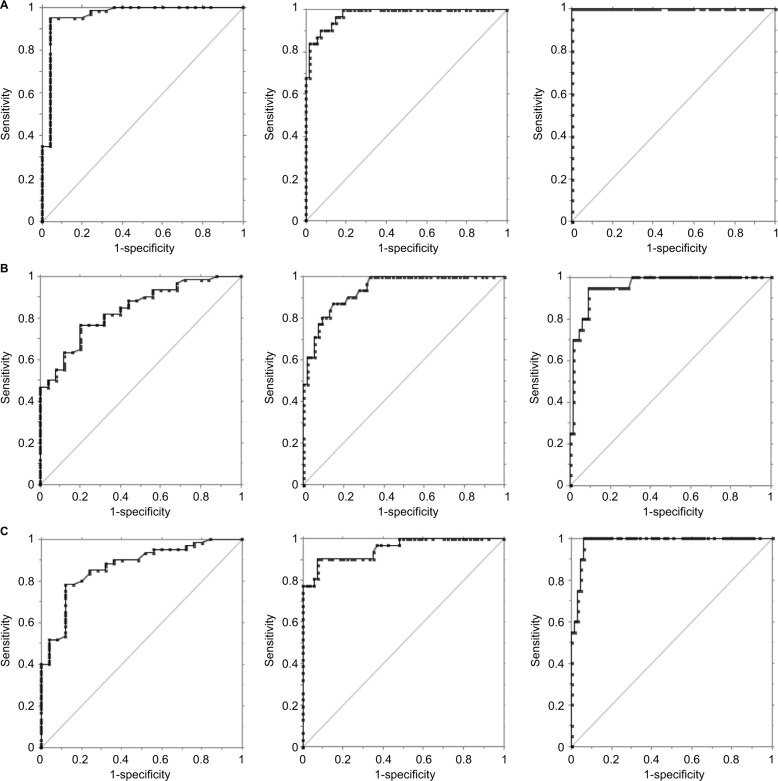
Figure 4.
ROC plots of different AHI cutoffs (5, 15, and 30 columns, respectively).
Notes: (A) The simultaneous (in-laboratory) PSG (reference PSG) and PDX (AUC =0.96, 0.98, 1.0, respectively); (B) the in-laboratory PSG and at-home PDX (AUC =0.84, 0.94, 0.96, respectively); and (C) the reference and separate PSGs (AUC =0.87, 0.95, 0.98, respectively).
Abbreviations: ROC, receiver operating characteristic; AUC, area under the ROC curve; PSG, polysomnography; AHI, apnea hypopnea index.

