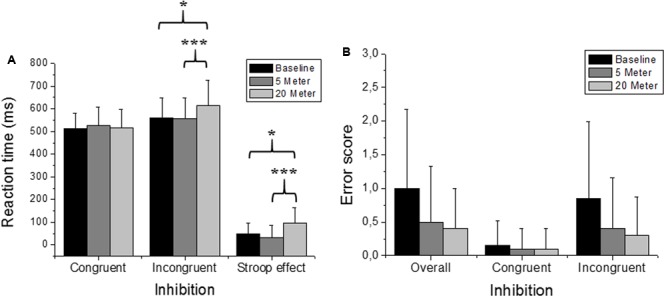
FIGURE 2.

Stroop task performance (i.e., inhibition). Depicted are mean reaction times and the mean errors. (A) Stroop task performance of the congruent and the incongruent stimuli and the resulting Stroop effect. (B) “Overall” represents all errors independent of the stimuli, while the separated errors for the congruent and incongruent stimuli are depicted as well. Values representing the arithmetic mean and error bars indicate the corresponding standard deviations. ∗Denotes p < 0.05 and ∗∗∗p < 0.001.
