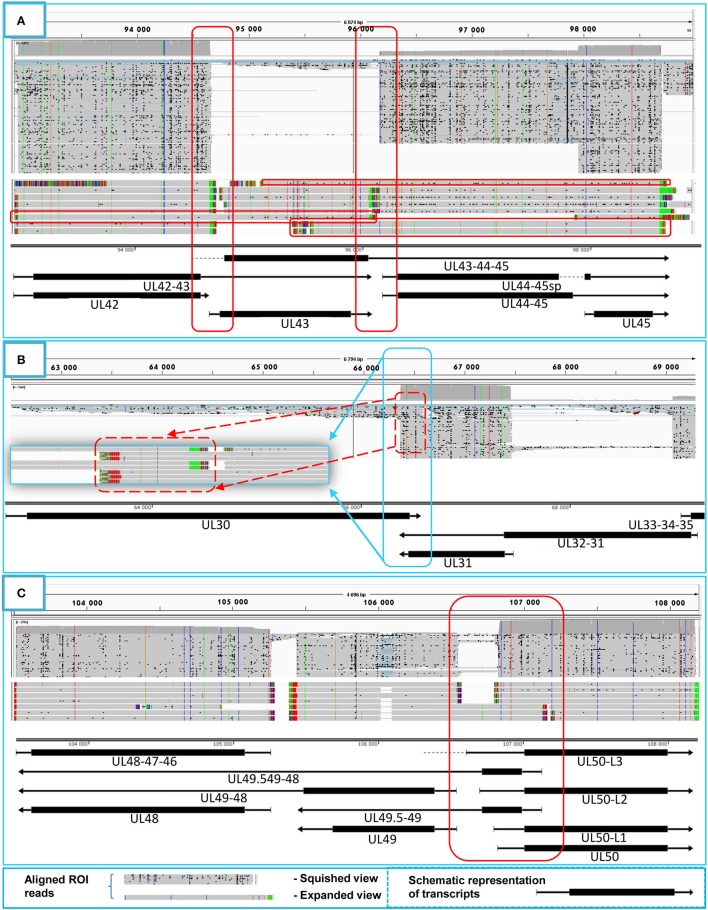
Figure 4.
Transcriptional overlaps. Transcriptional overlaps between adjacent genes. (A) Represents the parallel transcriptional overlap exemplified by the ul42, ul43, and ul44 genes, which is a unique genomic region of HSV-1 in the sense that the transcripts from these genes have their own transcription termination sites and only rarely form polycistronic transcripts. (B) Illustrates convergent “hard” transcriptional overlaps using the ul30 and ul31 genes as an example. The TES sequences of these genes are located within the transcribed region of the partner gene. (C) Illustrates the divergent transcriptional overlaps with the example of ul49.5 and ul50 genes. It can be seen that all of the isoforms of the UL50 transcript exhibit a large extent of overlap with the UL49.5 RNA molecules. The panels of this figure show the ROIs (gray color; squished and expanded view) and the coverage of reads across the given genomic regions. The overlapping transcripts are shown at the bottom of the figures. The colors indicate the poly(A) tails of the transcripts: green: from left to right orientation, red: from right to left orientation. The striped colors indicate the Clontech adaptor used for the PCR amplification.

