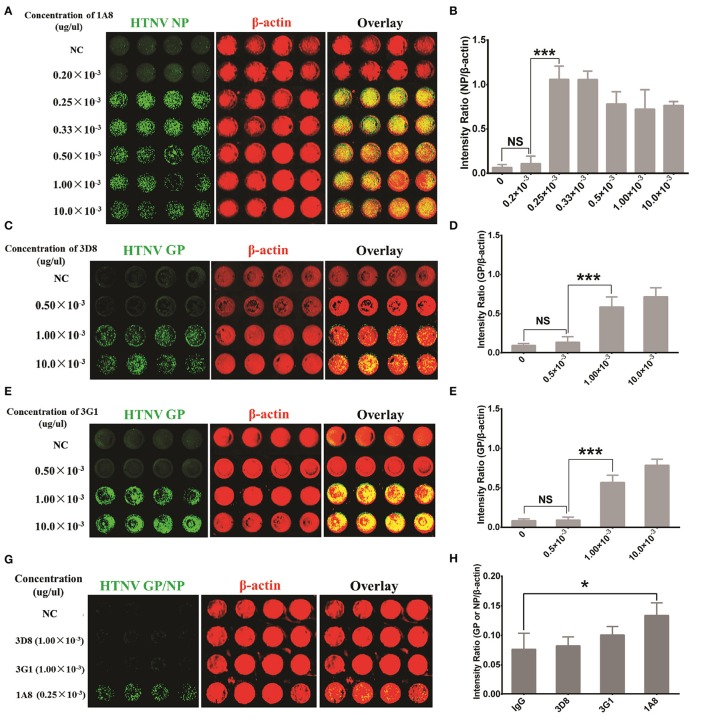
Figure 1.
Antibody selection for HTNV NP detection with sensitivity and rapidity. HUVECs grown in 96-well microplates until they reached 60–70% confluency were infected with HTNV at an MOI of 1. The cells were fixed and evaluated with the ICW assay at 3 days post-infection (A–F) or 1 day post-infection (G,H). (A,B) Mouse MAb 1A8 (1 μg/μl) were serially diluted to a final concentration of 10.0 × 10⁻³ (1:100 dilution), 1.00 × 10⁻³ (1:1,000 dilution), 0.50 × 10⁻³ (1:2,000 dilution), 0.33 × 10⁻³ (1:3,000 dilution), 0.25 × 10⁻³ (1:4,000 dilution) and 0.20 × 10⁻³ (1:5,000 dilution) (μg/μl). Sp2/0-derived mouse ascitic fluid was used as the negative control (NC). Different concentrations of 1A8 were applied in the ICW assay for HTNV NP detection. The scanned imaging results (A) and the intensity ratio (NP/β-actin) (B) are presented. (C,D) Serial dilutions of 3D8 targeting HTNV GP were applied in the ICW assay. The scanned imaging results (C) and the intensity ratio (GP/β-actin) (D) are presented. (E,F) Serial dilutions of 3G1 targeting HTNV GP were applied in the ICW assay. The scanned imaging results (C) and the intensity ratio (GP/β-actin) (D) are presented. (G,H) 3D8 (1.00 × 10⁻³ μg/μl), 3G1 (1.00 × 10⁻³ μg/μl) and 1A8 (0.25 × 10⁻³ μg/μl) were used in the ICW assay at 1 dpi, with Sp2/0-derived mouse ascitic fluid as the NC. The scanned imaging results (G) and the intensity ratio (GP or NP/β-actin) (H) are presented. Data are presented as the mean ± SD. *P < 0.05, ***P < 0.001 by Student's t-test. The experiments were performed independently at least three times with similar results.

