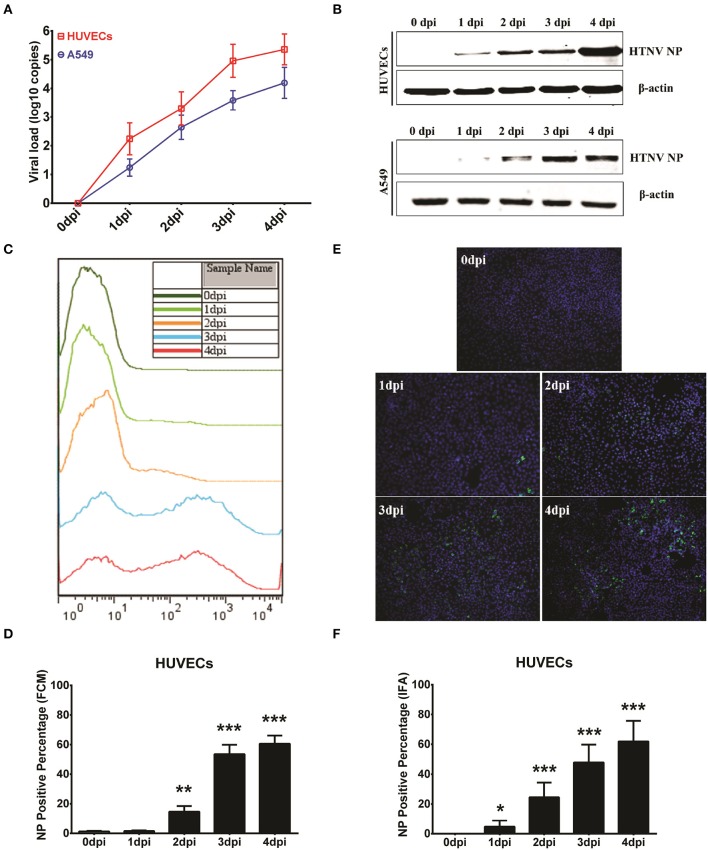
Figure 3.
Performance comparison of the ICW assay with conventional assays. HUVECs and A549 cells grown in 6-well plate until they reached 60–70% confluence were mock infected or infected with HTNV at an MOI of 0.1 and then harvested at 0 dpi, 1 dpi, 2 dpi, 3 dpi, and 4 dpi for qRT-PCR to detect the HTNV S segment. These samples were used to calculate the viral loads (A) or for Western blotting to measure HTNV NP expression (B). HUVECs infected at an MOI of 0.1 also underwent flow cytometry analysis (C,D) or an immunofluorescence assay (E,F) at the indicated time points post-HTNV infection. Data are presented as the mean ± SD. *P < 0.05, **P < 0.01, ***P < 0.001 vs. 0 dpi by Student's t-test. The experiments were performed independently at least three times with similar results.

