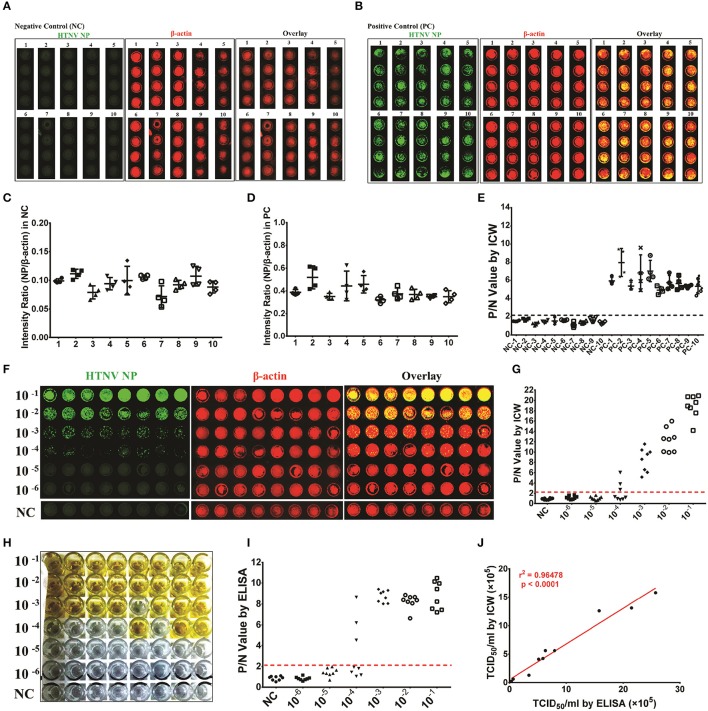
Figure 4.
Application of the ICW assay to detect the HTNV titers HUVECs were seeded into ten 96-well microplates of different brands (Falcon™ for microplates numbered 1–5 and Nunc™ numbered 6–10) and were mock infected (negative control, NC) or infected with HTNV at an MOI of 0.1 (positive control, PC). The ICW assay was performed to observe and calculate the amount of HTNV NP production (A and C for the NC group and B and D for the PC group). The P/N value was determined by setting the intensity ratio from the number 1 microplate as the calibrator (E). HTNV propagated in Vero E6 cells was serially diluted from 1:10 to 1:106 and used to infect A549 cells (F) or E6 cells (H) in 96-well microplates. A549 cells were acquired for the ICW assay at 2 dpi (F), and E6 cells were collected for ELISA at 10 dpi (H). The P/N value was calculated by ICW (G) and ELISA (I), and the viral titer was determined by TCID50 with the Reed and Muench formula. HTNV was propagated in mouse brains in five independent experiments and propagated in Vero E6 cells. The ten batches of HTNV were used for titer assessment by both ICW and ELISA. The relationship between the ICW-derived and ELISA-derived titers was analyzed using the rank correlation test (J). Data are presented as the mean ± SD.

